Core viewpoint:
Gold may continue to fluctuate at a high level and be weak next week, focusing on the breakthrough direction of the 3340-3395 range. The hawkish stance of the Federal Reserve suppresses gold prices, but geopolitical risk aversion and the decline of the US dollar form support. The technical side shows a long-short tug-of-war situation, and we need to be vigilant about the risk of breaking.
1. Analysis of key influencing factors
Federal Reserve policy suppression
The dot plot shows that there will be only two interest rate cuts in 2025, and long-term interest rate expectations will be raised, weakening the attractiveness of interest-free assets such as gold.
Risk point: If US economic data (such as PCE and unemployment rate) weaken significantly, hawkish expectations may be reversed.
Geopolitics and risk aversion
The situation in the Middle East, trade frictions and other events still provide bottom support for gold, limiting the downside space.
The trend of the US dollar is differentiated
The US dollar index rose and fell, and if it weakens further, it may ease the pressure on gold.
2. Key technical signals
The watershed between long and short positions
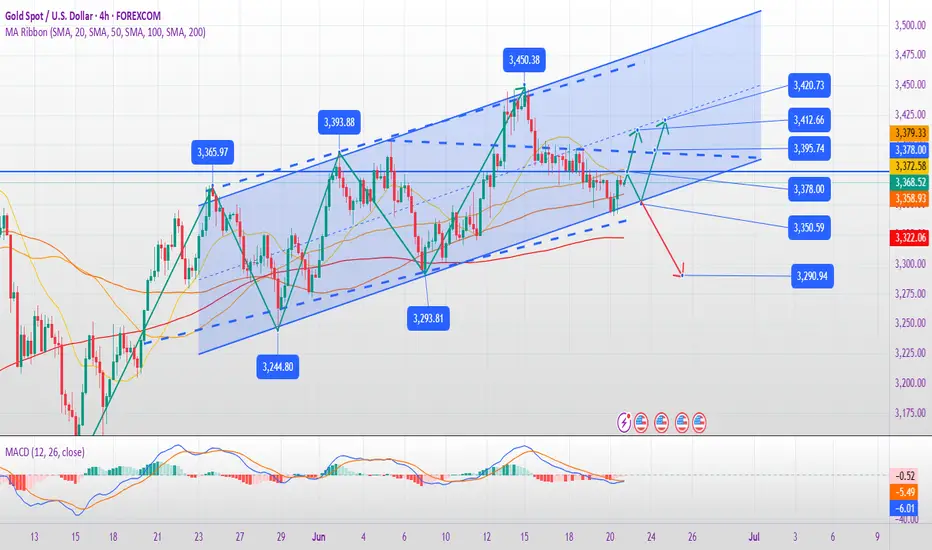
Support level: 3350-3340 (lower track of 4-hour channel), break down to 3250.
Resistance level: 3385-3395 (short-term trend line suppression), break through to test the previous high of 3450.
Indicator divergence
Weekly: MACD death cross appears initially, if confirmed, it will start mid-term adjustment.
Daily line: The momentum column turned to decline, but the volume did not fall, so be wary of false breakthroughs.
4 hours: The channel support near 3340 is the last line of defense for bulls, and if it fails, it will accelerate downward.
3. Trading strategy suggestions
Scenario 1: Range oscillation (probability 60%)
Operation logic: 3340-3395 range high sell low buy.
Short order: enter near 3385, stop loss above 3400, target 3350.
Long order: try long with a light position near 3340, stop loss 3320, target 3370-3380.
Scenario 2: Breaking support (30% probability)
Trigger condition: daily closing price is lower than 3340.
Follow-up strategy: short at 3360, stop loss at 3380, target 3250 (midline).
Scenario 3: Breaking resistance (10% probability)
Trigger condition: stand firm at 3395 and the dollar weakens.
Follow-up strategy: go long when it falls back to 3380, stop loss at 3365, target at 3450. Risk warning
Data risk: focus on US PCE inflation, GDP revisions and other data next week. If unexpectedly weak, gold may rebound.
Geopolitical emergencies: if the conflict escalates, safe-haven buying may push gold prices up rapidly.
Liquidity risk: month-end capital flows may amplify volatility, and positions need to be controlled.
Summary: Gold is short-term technically bearish but has not broken. It is recommended to focus on rebounding high and strictly stop loss. If 3340 is effectively broken, the trend will turn bearish; otherwise, if the support is held, there is still the possibility of a volatile upward trend.
Trade active
6.23 Latest gold trend analysis and operation strategy:
📌 Core logic:
Risk aversion dominated: US-Iran conflict escalated, gold gapped up, but no unilateral trend was formed, and it maintained a range of 3340-3400 in the short term.
Technical key positions:
Resistance: 3398 (intraday high/upper Bollinger rail), 3405 (previous high psychological barrier)
Support: 3340-3345 (lower Bollinger rail), 3325 (gap filling position)
Market sentiment: short-term bulls dominate, but be wary of profit-taking or sudden easing news leading to a pullback.
📊 Operation strategy:
1. Short position strategy (rebound and high)
Entry area: 3388-3393 (avoid false breakthrough)
Stop loss: 3405 (if the previous high is broken, the trend will turn strong and the short position will be invalid)
Target:
Short-term: 3365 (4-hour EMA20 support)
Band: 3345 (key support area)
Applicable conditions: The price rebounds above 3380 but does not break through 3400, and the 1-hour RSI (14) >70 (overbought signal).
2. Long-order strategy (lower long on pullback)
Ideal entry: 3340-3345 (Bollinger lower rail + gap support)
Alternative entry: 3325-3330 (if a sudden negative news causes a flash drop, observe the 15-minute K-line stabilization)
Stop loss: 3318 (if it falls below the previous low, the trend will turn bearish)
Target:
First target: 3375 (Asian session high)
Second target: 3398 (today's intraday high)
Break through 3405 and you can see 3420 (geo-premium mode starts)
⚠️Key risk reminder
Geo-emergency:
If Iran announces retaliation (such as blocking the Strait of Hormuz), gold may break through 3400 in an instant, and short orders need to strictly stop losses.
If the US and Iran suddenly negotiate and risk aversion cools down, gold may fill the gap to 3325.
Technical correction:
If it stands above 3360 before the European session, the short-order strategy will fail and may turn to a more volatile market.
As the volatility of the U.S. market increases, it is recommended to reduce positions or use options for hedging.
Trade closed: target reached
The latest gold trend analysis and trading strategies:
I. Macro-driven analysis
1️⃣ Geopolitical conflict escalates, risk aversion rises
On June 23, local time, Iran launched the twentieth round of large-scale missile and drone attacks on Israel, using the "Khyber" long-range missile to strike targets in Israel for the first time. At the same time, US submarines launched 30 "Tomahawk" cruise missiles and 12 MOP bunker-buster bombs at nuclear facilities in Iran, directly escalating the military conflict.
Iran claimed that it had released a large number of drones and warned that Israel's air defense system was close to saturation, causing the Middle East war to quickly enter a high-risk stage. The market's risk aversion sentiment has risen sharply, and gold has jumped higher during the day, continuing a wide range of fluctuations.
2️⃣ Trump's remarks disturbed market sentiment
Last Friday, Trump's statement that "the third aircraft carrier has been deployed in the Middle East" was confirmed by many parties to be exaggerated. In fact, it was only a conventional troop mobilization arrangement, which temporarily weakened the market's expectations for further escalation of the geopolitical situation, resulting in a retreat of gold's safe-haven buying in the late trading and suppressed gains.
However, with the fact of the conflict last weekend, risk aversion quickly returned, and gold formed a "high opening gap" pattern in early trading on Monday, and its risk aversion attribute was strengthened again.
3️⃣ The game between major powers intensified and medium- and long-term risks increased
The US strikes on Iran's nuclear facilities are aimed at curbing its nuclear capabilities. Iran's possible retaliatory countermeasures (such as blocking the Strait of Hormuz and expanding proxy conflicts) may trigger a global energy supply chain crisis. At the same time, Russia's provision of air defense support and the appearance of Chinese reconnaissance ships in the Persian Gulf have made the geopolitical situation more complicated, providing solid support for the medium- and long-term trend of gold.
2. Technical analysis of gold
🔍 Intraday market review and trend structure
Affected by risk aversion, gold continued to open high and go low on Monday this week, which was highly similar to the trend of last Monday. The highest intraday reached around 3398, and then adjusted.
The upward surge in the early Asian session just tested the previous trend line pressure level, and the overall structure still tended to rebound weakly. Intraday operations should maintain the idea of "mainly shorting at highs".
⏱ Analysis of key technical structures
4-hour chart: The moving average system has not turned significantly, indicating that the short-term rise of gold lacks sustainability, and the risk aversion has driven the rise and then retreated quickly;
1-hour chart: After the short-term downward trend was broken, gold once rose to around 3398. The current key support level is at 3340. If it continues to break down, it will test the 3320 first-line support;
Structural form: The hourly chart forms a preliminary prototype of a "double bottom". If 3340 is not broken, a second rebound may be launched, but the upward space is still limited by the strong resistance in the 3395-3405 area.
3. Trading strategy:
🎯 Sell at high rebound and short 3390-3405. If the strong pressure level is not broken, short short. Exit after breaking 3410. Target 3366-3355
🔄 Long with light position in callback 3350-3340. Short-term long test after stabilization. Stop loss after breaking 3335. Focus on 3380-3390 in rebound
🚫 Avoid chasing up —— The current volatile market is not suitable for chasing up —— ——
📌 Operation tips:
The current volatility of gold is dominated by geopolitical risk news, which is prone to rapid rise and fall. Pay attention to controlling positions and stop loss discipline;
Pay attention to the trend of the US dollar index, the linkage of crude oil prices, and the synchronous performance of market risk aversion indexes (such as VIX) during the trading session;
If the price breaks through 3405 and stabilizes, it is necessary to adjust the thinking and follow the trend.
❤️Free gold trading signals:t.me/+OJSbWQ6F4KM2Mzk1
💥Gold trading analyst | Technology + logic dual drive
💯Intraday/band strategy analysis | Risk control first, win in stability
💥Gold trading analyst | Technology + logic dual drive
💯Intraday/band strategy analysis | Risk control first, win in stability
Related publications
Disclaimer
The information and publications are not meant to be, and do not constitute, financial, investment, trading, or other types of advice or recommendations supplied or endorsed by TradingView. Read more in the Terms of Use.