The strengthening of the US dollar suppressed the gold price: the US dollar index rebounded, and gold fell under pressure.
Impact of tariff policy: The tariff policy during the Trump period was restored, and the market risk aversion fluctuated, but it did not significantly boost gold.
Expectations of the Fed's interest rate cut: Weak inflation data strengthened expectations of interest rate cuts, but short-term support for gold was limited.
Key event risks:
Powell's speech (next Tuesday): The market is paying attention to his statement on interest rate policy.
Fed officials have spoken intensively: This may affect the market's expectations of the pace of interest rate cuts.
[Technical analysis]
1. Daily level
The closing price fell below 3300 (the middle track support of the Bollinger band), and the weekly decline exceeded 2.1%, with bears dominating.
Key support: 3250 (if it falls below, it may accelerate downward).
Key resistance: 3325 (if it breaks through, it may return to oscillating upward).
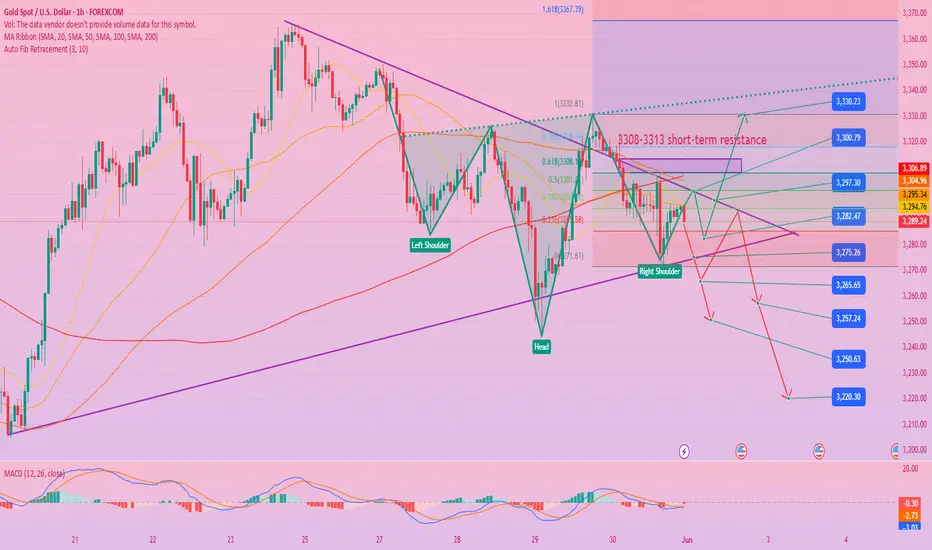
2. 1-hour level
The moving average is short-term, the 3325 resistance is strong, and the short-term rebound momentum is insufficient.
Friday's trend: The Asian and European sessions fluctuated downward, with the lowest at 3271. After rebounding, it fell again, indicating that the main force was washing the market.
Short-term trend: If it fails to break through the 3310-3313 resistance zone, it may continue to test 3250.
[Operation strategy]
1. Short position layout (main strategy)
Entry range: 3308-3313 (rebound test resistance level)
Stop loss: above 3320 (prevent false breakthrough)
Target: 3295→3285→3250 (take profit in batches)
2. Long orders are carefully observed (counter-trend strategy)
Conditions: If it quickly drops to 3250 and stabilizes, you can go long with a light position (need to cooperate with oversold signals or US dollar pullback).
Stop loss: below 3240 (prevent further breakout).
[Key risk reminder]
Powell's speech: If a strong dovish signal is released (such as clarifying the time for interest rate cuts), the decline in gold may be reversed.
Geopolitical emergencies: If the situation escalates, safe-haven buying may push gold higher in the short term.
Dollar trend: If the dollar pulls back, gold may see a technical rebound.
[Summary]
Short-term trend: Bearish, pay attention to the pressure in the 3300-3313 resistance zone.
Trading strategy: Mainly short selling on rebound, strictly set stop loss, and avoid blindly buying at the bottom.
Medium- and long-term focus: Fed policy trends and economic data, if expectations of interest rate cuts heat up, gold may usher in a new round of gains.
(The market is changing rapidly, it is recommended to flexibly adjust strategies based on real-time data to control risks.)
Trade active
Analysis of the latest gold trend on June 3:
1. Analysis of the core drivers of the current market
Geopolitical risks escalate
The worsening of the conflict between Russia and Ukraine has boosted risk aversion demand. Gold, the US dollar and US bonds have strengthened simultaneously, indicating that the market has a strong risk aversion sentiment.
If the situation escalates further (such as NATO's direct intervention), the price of gold may accelerate to 3400+.
Trade friction risk
The United States intends to expand steel and aluminum tariffs. The market is worried that the global supply chain will be hit again. The rebound in inflation expectations is good for gold.
Key risk events this week
Non-agricultural data (if the job market cools down → the Fed's interest rate cut expectations heat up → bullish for gold)
Central bank policy (ECB/Fed officials' speeches, if dovish, support gold prices)
2. Key technical signals (1-hour chart)
✅ Trend structure
The moving average is arranged in a bullish pattern (5EMA > 10EMA > 20EMA), and the price runs along the upper track of the Bollinger band, which is strong in the short term.
Key support/resistance:
Support area: 3340-3350 (previous high support + Fibonacci 38.2% retracement)
Resistance area: 3380 (psychological barrier) → 3400 (previous high + integer barrier)
✅ Momentum indicator
MACD: Double-line golden cross, the bar is enlarged, but close to the overbought area, be wary of short-term corrections.
RSI(14): 62 (not overbought, still has room to rise).
III. Refined Trading Strategy
1. Long Entry Plan
(1) Pullback and Go Long (Main Strategy)
Ideal Entry Range: 3340-3350 (Combined with K-line reversal signals, such as hammer line/bullish engulfing)
Stop loss: 3328 (break through previous low + channel lower track, confirm trend destruction)
Target 1: 3375-3380 (previous high pressure, partial profit stop)
Target 2: 3400 (look to 3420 after breakthrough)
(2) Breakout and Go Long (Secondary Strategy)
If the price breaks through 3380 strongly and stabilizes, you can go long with a light position, stop loss 3365, and target 3400-3420.
2. Short Hedging Strategy (Caution!)
If the price falls below 3328, it may turn short, and you can look to 3310-3300 in the short term (but it depends on whether the fundamentals have turned).
IV. Risk management and position control
Position ratio: a single transaction should not exceed 3%-5% of the total funds.
Stop loss discipline: strictly stop loss at 3328 and avoid emotional holding of orders.
Dynamic stop profit:
If the price reaches 3375-3380, you can reduce your position by 50%, and the remaining position will be protected by stop loss to 3350.
If it reaches 3400, exit all or keep a very small position to fight for higher prices.
Related publications
Disclaimer
The information and publications are not meant to be, and do not constitute, financial, investment, trading, or other types of advice or recommendations supplied or endorsed by TradingView. Read more in the Terms of Use.
Related publications
Disclaimer
The information and publications are not meant to be, and do not constitute, financial, investment, trading, or other types of advice or recommendations supplied or endorsed by TradingView. Read more in the Terms of Use.