This week, after opening at $3,369/oz,  XAUUSD prices fluctuated within a fairly narrow range, from only $3,340-$3,374/oz, and closed at $3,368/oz. The fact that gold prices closed this week close to the opening price shows that investors are hesitant in the current context.
The reason why gold prices are still fluctuating within a narrow range this week is because US President Donald Trump gave Iran a 2-week deadline to consider negotiating an end to the conflict with Israel, even though the Israel-Iran conflict is still raging.
In addition, on June 12, the Fed kept interest rates unchanged at 4.25% - 4.5%, while adjusting its forecast for US GDP growth lower and raising its estimate for near-term inflation. Fed Chairman Jerome Powell acknowledged that tariffs would push up prices and weigh on economic activity. Although two rate cuts are expected before the end of the year, Powell said the Fed may wait for more clarity before cutting rates.
Next week, the Fed Chairman will hold two semiannual monetary policy hearings before the US House and Senate committees on Tuesday and Wednesday. If Fed Chairman Powell hints at a rate cut in September 2025, the USD could fall against other major currencies, causing gold prices to rise next week. Conversely, if the Fed Chairman emphasizes that they will continue to prioritize controlling inflation and is in no hurry to cut interest rates, the USD will rise, thereby pushing gold prices down next week.
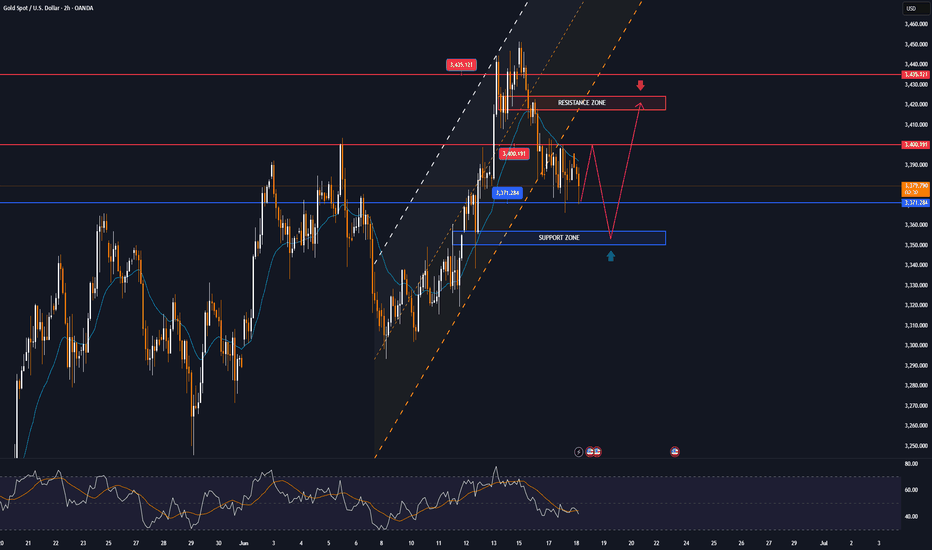
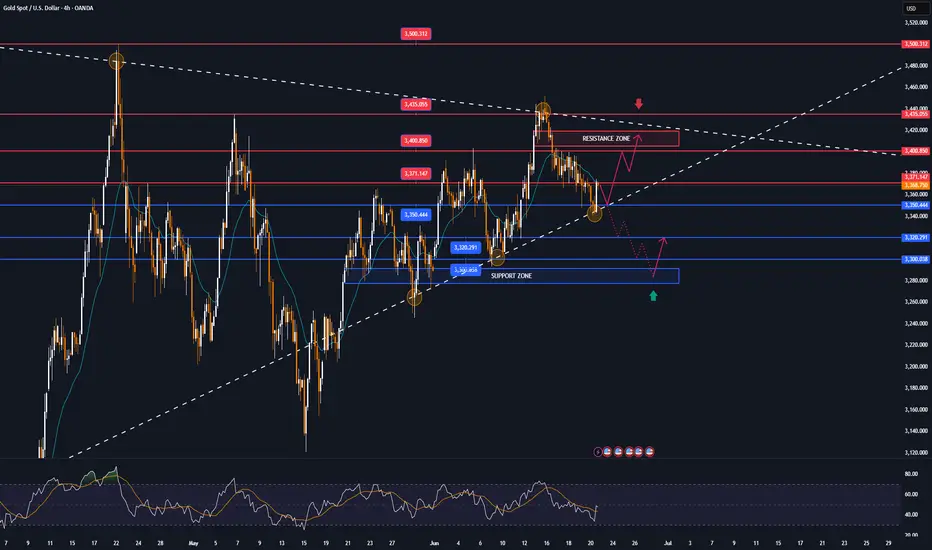
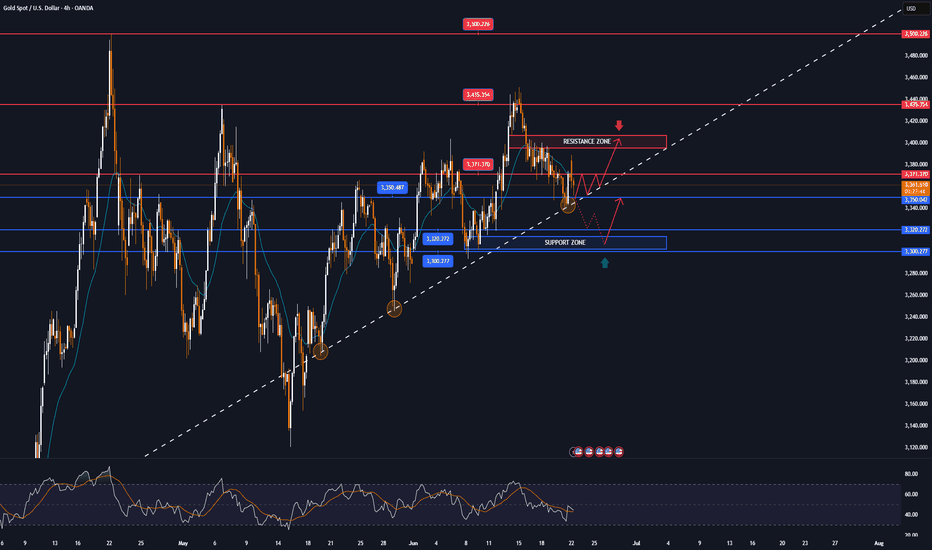
📌Technically, the gold price on the H4 and D1 charts is stuck between the range of 3295-3450, which is an important support level around 3295, and the resistance level at 3450.
The current price is moving sideways and accumulating in smaller time frames, and the trend has not been clearly defined when it has not broken through the above two resistance levels.
There are two scenarios for gold.
In the long-term framework, if it breaks through the 3450 zone and breaks the trend at the same time, it is expected that the gold price will set a new high.
In the case that the gold price trades below the 3300 round resistance, and at the same time the 3295 support zone is broken, it is easy to form a head and shoulders pattern on the H4 chart.
Notable technical levels are listed below.
Support: 3,350 – 3,320 – 3,300USD
Resistance: 3,371 – 3,400 – 3,435 – 3,500USD
SELL XAUUSD PRICE 3412 - 3410⚡️
↠↠ Stop Loss 3416
BUY XAUUSD PRICE 3294 - 3296⚡️
↠↠ Stop Loss 3290
The reason why gold prices are still fluctuating within a narrow range this week is because US President Donald Trump gave Iran a 2-week deadline to consider negotiating an end to the conflict with Israel, even though the Israel-Iran conflict is still raging.
In addition, on June 12, the Fed kept interest rates unchanged at 4.25% - 4.5%, while adjusting its forecast for US GDP growth lower and raising its estimate for near-term inflation. Fed Chairman Jerome Powell acknowledged that tariffs would push up prices and weigh on economic activity. Although two rate cuts are expected before the end of the year, Powell said the Fed may wait for more clarity before cutting rates.
Next week, the Fed Chairman will hold two semiannual monetary policy hearings before the US House and Senate committees on Tuesday and Wednesday. If Fed Chairman Powell hints at a rate cut in September 2025, the USD could fall against other major currencies, causing gold prices to rise next week. Conversely, if the Fed Chairman emphasizes that they will continue to prioritize controlling inflation and is in no hurry to cut interest rates, the USD will rise, thereby pushing gold prices down next week.
📌Technically, the gold price on the H4 and D1 charts is stuck between the range of 3295-3450, which is an important support level around 3295, and the resistance level at 3450.
The current price is moving sideways and accumulating in smaller time frames, and the trend has not been clearly defined when it has not broken through the above two resistance levels.
There are two scenarios for gold.
In the long-term framework, if it breaks through the 3450 zone and breaks the trend at the same time, it is expected that the gold price will set a new high.
In the case that the gold price trades below the 3300 round resistance, and at the same time the 3295 support zone is broken, it is easy to form a head and shoulders pattern on the H4 chart.
Notable technical levels are listed below.
Support: 3,350 – 3,320 – 3,300USD
Resistance: 3,371 – 3,400 – 3,435 – 3,500USD
SELL XAUUSD PRICE 3412 - 3410⚡️
↠↠ Stop Loss 3416
BUY XAUUSD PRICE 3294 - 3296⚡️
↠↠ Stop Loss 3290
Note
🔴Spot gold prices fell around $14 in the short term and are currently trading at $3,352.47 an ounce, with intraday losses extending to 0.46%.Note
Note
🔴Spot gold prices continued to decline, down 1.00% on the day to $3,333.82 an ounce.Note
🔴Spot gold continued to fall in the afternoon, testing 3316 twice before recovering. Combined with the short-term order trading line, the short-term buy order cost area is mainly concentrated at 3323 and 3320, which can be regarded as the "lifeline" of short-term buy orders.Trade active
Weekly Plan Buy +80pips🔼🔼🔼Trade closed: target reached
Weekly Plan Buy + 390pips, wonderful Profit💙💙💙Note
📊 Gold struggles around $3,300: Weak dollar, US-Iran talks and economic data key to directionNote
🔴Gold prices fluctuate ahead of PCE data, amid expectations of Fed rate cuts and easing geopolitical tensionsNote
🔴Spot gold hits $3,310On July 7, spot gold continued to fall, down to $3,310/ounce, down 0.83% on the day.
🔰| Forex trading
🧩Get an average of 1200 pips per month
🧩Consulting on Risk Management
🧩Account management
🧩Forex signals have a high win rate
🚨🚨🚨FREE SIGNALS: t.me/+8q3AxDD9CsRjYzI1
🧩Get an average of 1200 pips per month
🧩Consulting on Risk Management
🧩Account management
🧩Forex signals have a high win rate
🚨🚨🚨FREE SIGNALS: t.me/+8q3AxDD9CsRjYzI1
Related publications
Disclaimer
The information and publications are not meant to be, and do not constitute, financial, investment, trading, or other types of advice or recommendations supplied or endorsed by TradingView. Read more in the Terms of Use.