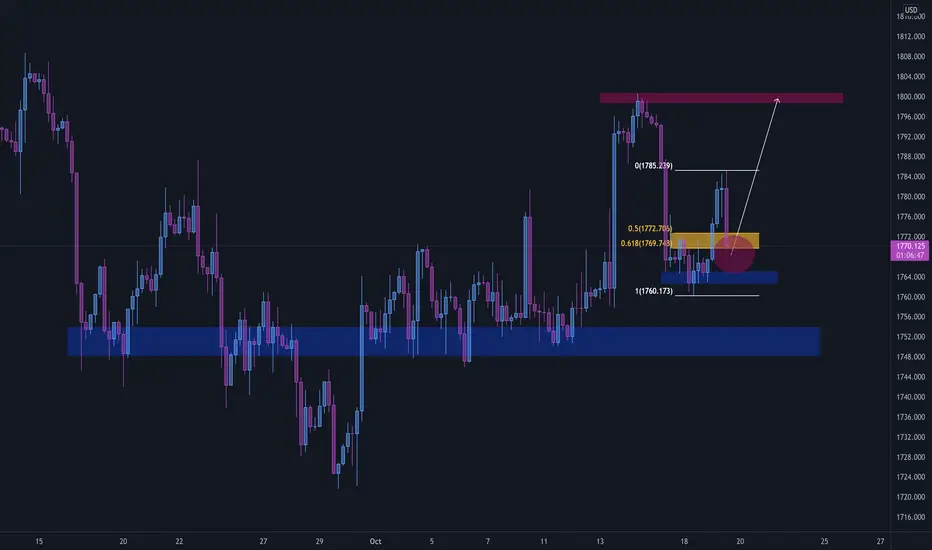
The sentiment of the GOLD market is clearly bullish. As we can observe from the graph, after series of long and dull consolidations, a massive candle was able to break the upper boundary of the sideways moving range last week. The price dropped again right after, in order to correct the massive bull candle and re-test the area of the broken resistance.
Now, as we can see from the chart, the price is currently testing a zone of previous resistance turned support on lower timeframes, which also aligns with the golden fibonacci ratio. We are now waiting for the price to carefully retrace this zone and form a nice mini-bottom, before we open long positions and aim for the previous Higher High.
Happy trading, family!
Disclaimer
The information and publications are not meant to be, and do not constitute, financial, investment, trading, or other types of advice or recommendations supplied or endorsed by TradingView. Read more in the Terms of Use.
Disclaimer
The information and publications are not meant to be, and do not constitute, financial, investment, trading, or other types of advice or recommendations supplied or endorsed by TradingView. Read more in the Terms of Use.