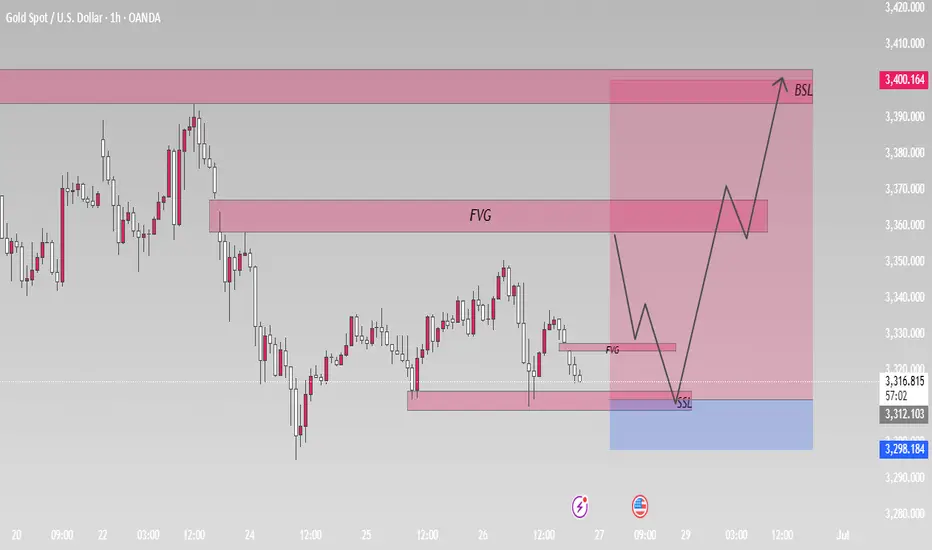
This chart shows a Gold Spot (XAU/USD) analysis on the 1-hour timeframe, with technical elements typically used in smart money concepts (SMC). Here's a breakdown of what's shown:
Key Chart Elements:
FVG (Fair Value Gap):
Two FVG zones are marked in pink rectangles, one around the mid-3,300s and another lower down.
These indicate imbalance zones where price moved rapidly and may return to fill the gap.
SSL (Sell-side Liquidity):
Marked below current price action, suggesting a possible liquidity sweep (stop-hunt) before a reversal.
BSL (Buy-side Liquidity):
Marked above current price (near 3,400), indicating potential target zone for a bullish move.
Price Projection Path:
A zig-zag black line illustrates a projected bullish move:
Dip below current price to sweep SSL.
Quick recovery into FVG.
Break of structure and move higher.
Final target near 3,400 (BSL).
Support & Resistance Zones:
Marked in pink rectangles, showing historical reaction levels and potential areas of interest.
News Event Symbol:
Appears at the bottom of the chart, likely signaling upcoming macroeconomic data that could influence volatility.
Interpretation:
The chart suggests a bullish bias after a liquidity sweep below the recent lows (SSL), aiming for a rally toward 3,400 (BSL). The FVG zones may act as resistance-turned-support or retracement targets on the way up.
💰 Making Millions with Mariam_Oliver 💰
🔥 6+ Years of Mastery in Forex Trading
✅ 100% Precision Signals – Trusted by Thousands
🚀 Real Results. Real Profits. Real Fast.
👑 Learn from the Best. Trade like the Rest Can't.
#HabibiLetMakeMili 💵
🔥 6+ Years of Mastery in Forex Trading
✅ 100% Precision Signals – Trusted by Thousands
🚀 Real Results. Real Profits. Real Fast.
👑 Learn from the Best. Trade like the Rest Can't.
#HabibiLetMakeMili 💵
Disclaimer
The information and publications are not meant to be, and do not constitute, financial, investment, trading, or other types of advice or recommendations supplied or endorsed by TradingView. Read more in the Terms of Use.