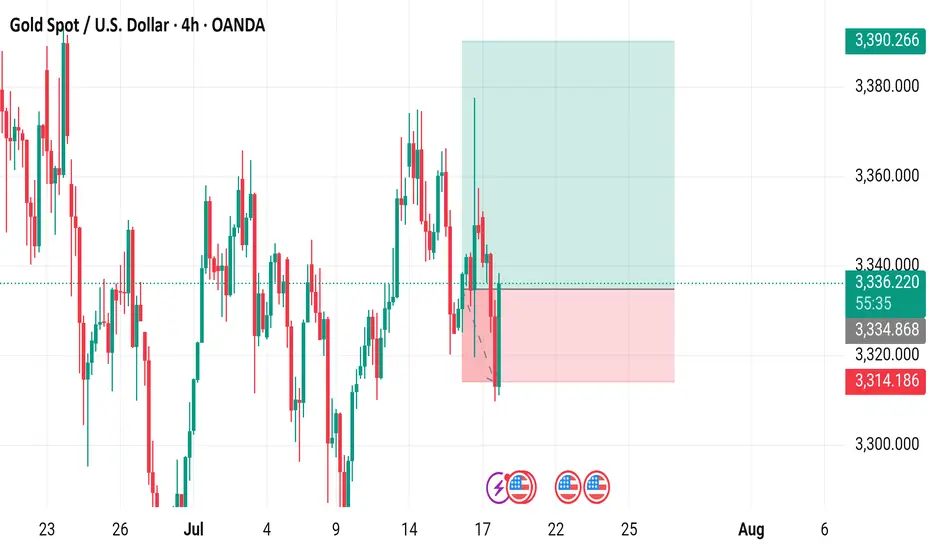
4-hour chart displays the price movement of Gold Spot (XAU) against the U.S. Dollar (USD) from late July to early August 2025. The current price is 3,390.266, with a recent decrease of 10.870 (-0.32%). Key levels include a sell price of 3,336.420 and a buy price of 3,337.020, with a resistance zone highlighted between 3,340.720 and 3,380.000, and a support zone around 3,314.186. The chart includes candlestick patterns and trading indicators.
Trade active
Active tradesTrade closed: target reached
Perfect target achieved guy's Daily XAU/USD FREE setups | Let's grow together!
| XAU/USD Trader | Telegram: https://t.me/Aleegoldsignals
| XAU/USD Trader | Telegram: https://t.me/Aleegoldsignals
Disclaimer
The information and publications are not meant to be, and do not constitute, financial, investment, trading, or other types of advice or recommendations supplied or endorsed by TradingView. Read more in the Terms of Use.
Daily XAU/USD FREE setups | Let's grow together!
| XAU/USD Trader | Telegram: https://t.me/Aleegoldsignals
| XAU/USD Trader | Telegram: https://t.me/Aleegoldsignals
Disclaimer
The information and publications are not meant to be, and do not constitute, financial, investment, trading, or other types of advice or recommendations supplied or endorsed by TradingView. Read more in the Terms of Use.