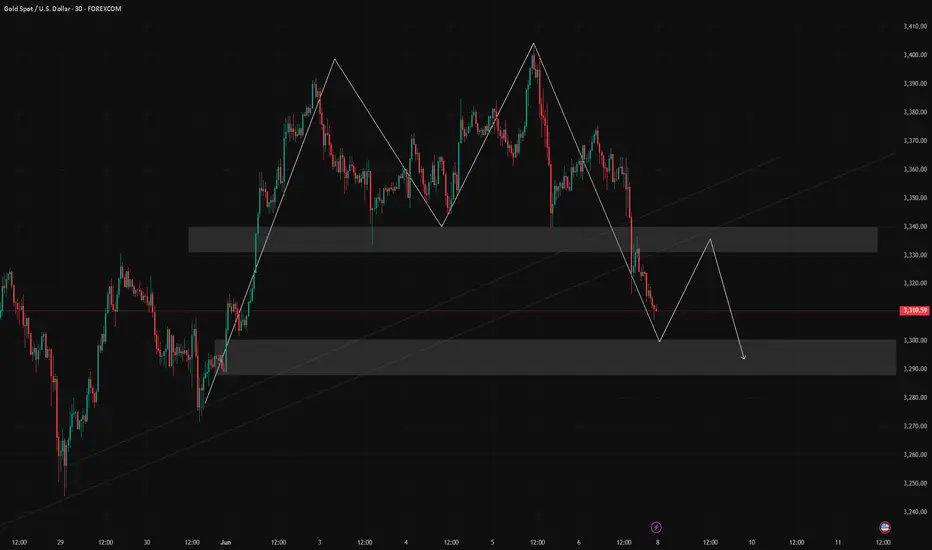
Last Friday, gold experienced a sharp drop, briefly testing the 3300 level. From a technical standpoint, the market has started to show early signs of bottom formation, which could materialize either as a double bottom / multiple bottom pattern, or through a direct upside breakout.
If the former unfolds, we expect a stronger and more sustainable rebound.
If it turns into a straight bullish leg, traders should be cautious of potential exhaustion in the rally, which may invite a renewed bearish attack.
📊 Key Macro Focus This Week:
Markets will be primarily influenced by data releases on Wednesday through Friday, including:
Monthly CPI
Initial Jobless Claims
Inflation Expectations
As a result, Monday's trading will be dominated by technical patterns, with a bias toward a corrective rebound. The strategic focus should be on buying near support, with short-term opportunities to sell near key resistance.
📌 Monday Trading Plan:
✅ Buy in the 3303–3286 zone (early base-building area)
✅ Sell in the 3343–3353 zone (overhead resistance)
🔄 Intraday pivot levels for tactical entries:
3338 / 3326 / 3317 / 3309
Trade active
Gold has surged by around $40, delivering solid returns in this rebound. While the price is now approaching a resistance level and may face a short-term pullback, the 1-hour chart still suggests potential for further upside. If a dip occurs, consider looking for new buying opportunities around key support levels.I’ve created a channel where I’ll be posting market analysis and trading signals.
Feel free to join—it makes it easier to follow updates, and you can also contact me directly if you have any questions.
t.me/+h6RM5RdP6X9hNmI8
Feel free to join—it makes it easier to follow updates, and you can also contact me directly if you have any questions.
t.me/+h6RM5RdP6X9hNmI8
Related publications
Disclaimer
The information and publications are not meant to be, and do not constitute, financial, investment, trading, or other types of advice or recommendations supplied or endorsed by TradingView. Read more in the Terms of Use.
I’ve created a channel where I’ll be posting market analysis and trading signals.
Feel free to join—it makes it easier to follow updates, and you can also contact me directly if you have any questions.
t.me/+h6RM5RdP6X9hNmI8
Feel free to join—it makes it easier to follow updates, and you can also contact me directly if you have any questions.
t.me/+h6RM5RdP6X9hNmI8
Related publications
Disclaimer
The information and publications are not meant to be, and do not constitute, financial, investment, trading, or other types of advice or recommendations supplied or endorsed by TradingView. Read more in the Terms of Use.