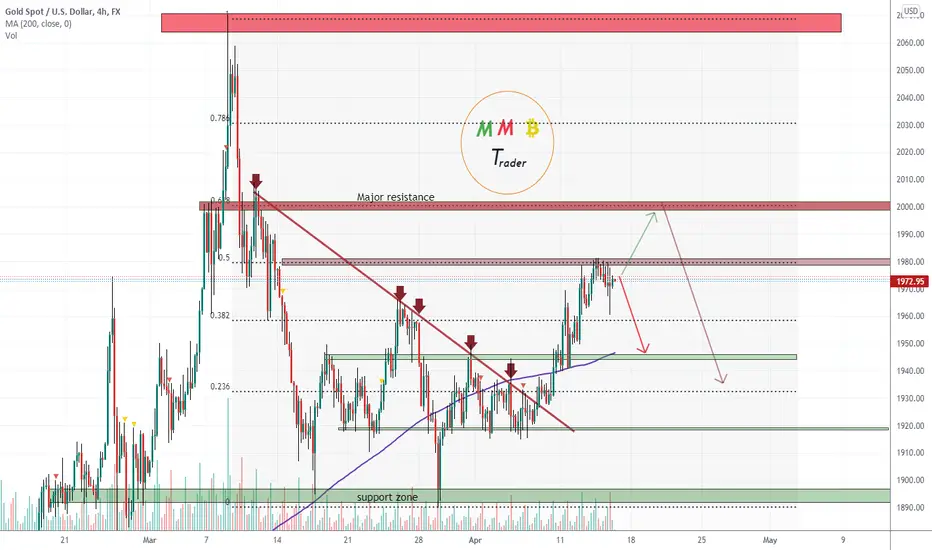
Based on Fibonacci resistance levels Major resistances now are:
A. 1980$ (0.5 Fib)
B. 2000$ (0.61 Fib)
and we are looking for fall near these resistance levels like the red arrows on the chart.
Notice: only if the 2000$ resistance break to the upside then again market here is extremely bullish.
<<press like👍 if you enjoy + comment your opinion about the market or your thoughts, below this analysis >>
My telegram channel:
t.me/mmbtchannel
VIP Channels:
Forex:+400Pips & Crypto +420% monthly profit at VIP.
check pinned messages in my telegram channel for more info.
Disclaimer
The information and publications are not meant to be, and do not constitute, financial, investment, trading, or other types of advice or recommendations supplied or endorsed by TradingView. Read more in the Terms of Use.