Analysis of gold market trends next week:
Analysis of gold news: Spot gold fluctuated and rose in a narrow range during the U.S. market on Friday (July 18), and is currently trading around $3,354.05 per ounce. On Thursday, spot gold staged a thrilling "deep V" market. Under the dual stimulation of the U.S. retail sales data in June exceeding expectations by 0.6% and the number of initial jobless claims falling to 221,000, the U.S. dollar index once soared to a monthly high of 98.95, instantly suppressing spot gold to an intraday low of $3,309.82 per ounce. But surprisingly, the gold price then rebounded strongly and finally closed at $3,338.86, down only 0.25%. This "fake fall" market reveals the deep contradictions in the current market-although economic data temporarily supports the strengthening of the U.S. dollar, investors' concerns about inflation caused by tariffs are forming a "hidden buying" of gold. The joint rise of the U.S. dollar and U.S. bond yields did suppress gold prices, but strong takeover orders emerged in each falling window. Behind this phenomenon, smart money is quietly making plans. When the 10-year U.S. Treasury yield climbed to a monthly high of 4.495%, gold refused to fall further. This divergence suggests that the market has serious differences on the direction of the Fed's policy.
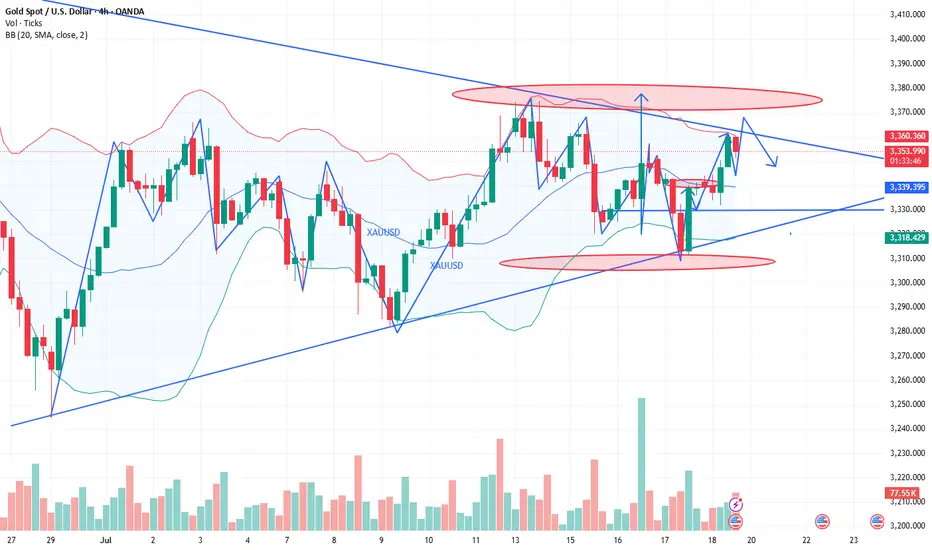
Technical analysis of gold: After the opening yesterday, gold continued to fall slowly, and the negative impact of the unemployment data in the U.S. market further suppressed the bullish momentum. The lowest price in the U.S. market reached 3310, and the cumulative decline for the whole day exceeded 30 US dollars. But the key is that gold rebounded again at midnight, forming a wide range of fluctuations on Thursday, which was completely in line with expectations. The 3310 bottom-picking and long-term strategy given during the session successfully captured large profits in the band. This trend once again verified the core judgment of this week: gold is in a high-level fluctuation dominated by a bullish trend, and the practical value of this view continues to highlight. After clarifying the current dual attributes of "bullish trend + volatile trend", Friday's trading needs to focus on the effective profit space within the range. It is expected that the 3375-3310 large range will be difficult to break this week, and the small range can be locked at 3355-3320. Before the range is broken, high-selling and low-buying operations can be performed.
.
The technical side shows that the daily line and the 4-hour Bollinger Bands are closed synchronously. At this time, there is no need to worry about the direction, and effective trading can be achieved by keeping a close eye on the range boundary. It is worth noting that the 4-hour moving average system has obvious upward divergence characteristics. Continuing the rebound momentum at midnight on Thursday, gold still has room to rise today, and the upper target is 3360-3365. The small cycle support is clear: 3330 and 3320 are not broken, both are good opportunities for long positions. During the US trading session, it is necessary to pay attention to the breaking of the 3365 and 3375 resistance levels: if the pressure is not broken, there will be room for a decline, and short-term short positions can be tried. On the whole, Charlie suggests that the short-term operation strategy for gold next week should focus on buying on pullbacks and buying on dips, supplemented by rebounds and selling on highs. The short-term focus on the upper side is the 3375-3385 line of resistance, and the short-term focus on the lower side is the 3340-3330 line of support. XAUUSD GOLD XAUUSD GOLD XAUUSD GOLD XAUUSD
Analysis of gold news: Spot gold fluctuated and rose in a narrow range during the U.S. market on Friday (July 18), and is currently trading around $3,354.05 per ounce. On Thursday, spot gold staged a thrilling "deep V" market. Under the dual stimulation of the U.S. retail sales data in June exceeding expectations by 0.6% and the number of initial jobless claims falling to 221,000, the U.S. dollar index once soared to a monthly high of 98.95, instantly suppressing spot gold to an intraday low of $3,309.82 per ounce. But surprisingly, the gold price then rebounded strongly and finally closed at $3,338.86, down only 0.25%. This "fake fall" market reveals the deep contradictions in the current market-although economic data temporarily supports the strengthening of the U.S. dollar, investors' concerns about inflation caused by tariffs are forming a "hidden buying" of gold. The joint rise of the U.S. dollar and U.S. bond yields did suppress gold prices, but strong takeover orders emerged in each falling window. Behind this phenomenon, smart money is quietly making plans. When the 10-year U.S. Treasury yield climbed to a monthly high of 4.495%, gold refused to fall further. This divergence suggests that the market has serious differences on the direction of the Fed's policy.
Technical analysis of gold: After the opening yesterday, gold continued to fall slowly, and the negative impact of the unemployment data in the U.S. market further suppressed the bullish momentum. The lowest price in the U.S. market reached 3310, and the cumulative decline for the whole day exceeded 30 US dollars. But the key is that gold rebounded again at midnight, forming a wide range of fluctuations on Thursday, which was completely in line with expectations. The 3310 bottom-picking and long-term strategy given during the session successfully captured large profits in the band. This trend once again verified the core judgment of this week: gold is in a high-level fluctuation dominated by a bullish trend, and the practical value of this view continues to highlight. After clarifying the current dual attributes of "bullish trend + volatile trend", Friday's trading needs to focus on the effective profit space within the range. It is expected that the 3375-3310 large range will be difficult to break this week, and the small range can be locked at 3355-3320. Before the range is broken, high-selling and low-buying operations can be performed.
.
The technical side shows that the daily line and the 4-hour Bollinger Bands are closed synchronously. At this time, there is no need to worry about the direction, and effective trading can be achieved by keeping a close eye on the range boundary. It is worth noting that the 4-hour moving average system has obvious upward divergence characteristics. Continuing the rebound momentum at midnight on Thursday, gold still has room to rise today, and the upper target is 3360-3365. The small cycle support is clear: 3330 and 3320 are not broken, both are good opportunities for long positions. During the US trading session, it is necessary to pay attention to the breaking of the 3365 and 3375 resistance levels: if the pressure is not broken, there will be room for a decline, and short-term short positions can be tried. On the whole, Charlie suggests that the short-term operation strategy for gold next week should focus on buying on pullbacks and buying on dips, supplemented by rebounds and selling on highs. The short-term focus on the upper side is the 3375-3385 line of resistance, and the short-term focus on the lower side is the 3340-3330 line of support.
Real-time strategies are like a beacon guiding your investment path. The market will never disappoint those who persevere and explore wisely....🚀🚀VIP Channel t.me/EagleEyePrecisionAnalysis
👉Exclusive address t.me/Eagle_PreciseAnalysis
👉Exclusive address t.me/Eagle_PreciseAnalysis
Disclaimer
The information and publications are not meant to be, and do not constitute, financial, investment, trading, or other types of advice or recommendations supplied or endorsed by TradingView. Read more in the Terms of Use.