hi traders,
let's have a look at Gold on 3D time frame.
✅ Technical Outlook:
Uptrend Still Intact
Price action remains firmly within a higher high, higher low structure, confirming that Gold is still in an active uptrend.
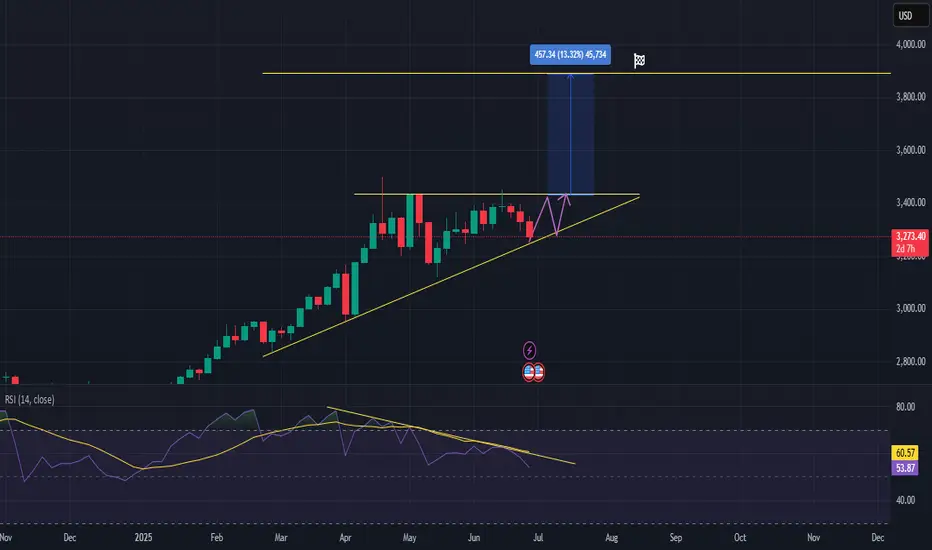
* We can observe the Ascending Triangle Formation.
An ascending triangle has formed, with the price consistently finding support on a rising trendline while pressing against the horizontal resistance around $3,430.
This pattern typically acts as a bullish continuation, especially within strong trends.
Potential Breakout Target
If XAUUSD breaks above the horizontal resistance, the measured move (height of the triangle) points to a potential upside of ~13.32%, targeting the $3,880–3,900 zone.
RSI Observations
The RSI is consolidating just above 50 and remains in bullish territory. A breakout above the RSI trendline would further support bullish momentum.
📌 Trade Scenario (Plan A – Bullish Breakout):
Entry: Upon breakout and daily close above ~$3,430
Target: ~$3,880
Support Trendline: Acting as dynamic support
📌 Alternate Scenario (Plan B – Retest):
Price may retest the ascending trendline support before attempting a breakout. This would offer a lower-risk entry opportunity with tighter invalidation.
🧠 Summary:
Gold remains in a strong uptrend, and the formation of an ascending triangle suggests a likely continuation to the upside. Watch for a breakout confirmation above the horizontal resistance for a potential high-probability long setup.
let's have a look at Gold on 3D time frame.
✅ Technical Outlook:
Uptrend Still Intact
Price action remains firmly within a higher high, higher low structure, confirming that Gold is still in an active uptrend.
* We can observe the Ascending Triangle Formation.
An ascending triangle has formed, with the price consistently finding support on a rising trendline while pressing against the horizontal resistance around $3,430.
This pattern typically acts as a bullish continuation, especially within strong trends.
Potential Breakout Target
If XAUUSD breaks above the horizontal resistance, the measured move (height of the triangle) points to a potential upside of ~13.32%, targeting the $3,880–3,900 zone.
RSI Observations
The RSI is consolidating just above 50 and remains in bullish territory. A breakout above the RSI trendline would further support bullish momentum.
📌 Trade Scenario (Plan A – Bullish Breakout):
Entry: Upon breakout and daily close above ~$3,430
Target: ~$3,880
Support Trendline: Acting as dynamic support
📌 Alternate Scenario (Plan B – Retest):
Price may retest the ascending trendline support before attempting a breakout. This would offer a lower-risk entry opportunity with tighter invalidation.
🧠 Summary:
Gold remains in a strong uptrend, and the formation of an ascending triangle suggests a likely continuation to the upside. Watch for a breakout confirmation above the horizontal resistance for a potential high-probability long setup.
💥 Free signals and ideas ➡ t.me/vfinvestment
Disclaimer
The information and publications are not meant to be, and do not constitute, financial, investment, trading, or other types of advice or recommendations supplied or endorsed by TradingView. Read more in the Terms of Use.
💥 Free signals and ideas ➡ t.me/vfinvestment
Disclaimer
The information and publications are not meant to be, and do not constitute, financial, investment, trading, or other types of advice or recommendations supplied or endorsed by TradingView. Read more in the Terms of Use.