1. Well-Defined Resistance Zones
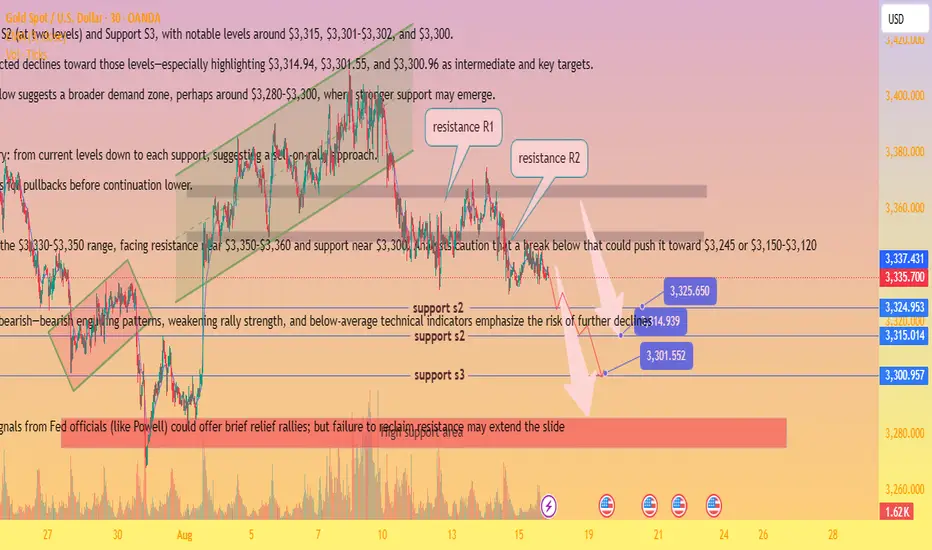
Two horizontal shaded areas labeled Resistance R1 and Resistance R2 mark zones near $3,360–$3,380, where price repeatedly failed to break higher.
Trading ideas from analysts on TradingView reinforce that the immediate resistance lies around $3,364–$3,370. As long as price stays below that, sellers remain in control
2. Descending Channel & Bearish Momentum
The chart highlights a shift from an earlier ascending channel (green), followed by breakdown and decline — a classic reversal from bullish to bearish.
In line with this, there’s also mention of a bearish flag pattern forming on the 30-minute (M30) timeframe, offering a potential shorting opportunity
3. Key Support Levels & Targets
Multiple support levels annotated: Support S2 (at two levels) and Support S3, with notable levels around $3,315, $3,301–$3,302, and $3,300.
The annotated price action indicates projected declines toward those levels—especially highlighting $3,314.94, $3,301.55, and $3,300.96 as intermediate and key targets.
Ultimately, the red “High support area” below suggests a broader demand zone, perhaps around $3,280–$3,300, where stronger support may emerge.
4. Trading Plan Illustrated
White arrows depict a descending trajectory: from current levels down to each support, suggesting a sell-on-rally approach.
Blue markers denote possible bounce points for pullbacks before continuation lower.
Broader Market Context
Gold prices have recently been tracking in the $3,330–$3,350 range, facing resistance near $3,350–$3,360 and support near $3,300. Analysts caution that a break below that could push it toward $3,245 or $3,150–$3,120
Overall momentum has turned cautious or bearish—bearish engulfing patterns, weakening rally strength, and below-average technical indicators emphasize the risk of further declines
Weak U.S. economic indicators or dovish signals from Fed officials (like Powell) could offer brief relief rallies; but failure to reclaim resistance may extend the slide
Key Levels at a Glance
Level Type Price Range Notes
Resistance ~$3,350–$3,360+ Strong ceiling—decline confirms bearish bias
Support S1 ~$3,315–$3,320 First potential reaction zone
Support S2 ~$3,301 Intermediate target for sellers
Support S3 ~$3,300 Psychological barrier; near high support zone
High Support Area ~$3,280–$3,300 Zone where bullish buyers might regroup
Conclusion
chart effectively captures a short-term bearish trend in gold (XAU/USD), showing:
Failed attempts to overcome resistance near $3,360.
A bearish flag breakout signaling potential continuation downward.
Clearly plotted support targets, with bounce zones drawn out.
A visual trade plan suggesting sell-on-rallies targeting declining support levels until reaching a strong demand zone.
To succeed with this setup, traders might wait for a brief rally into one of the identified sell zones (e.g. ~$3,314 or $3,325) before entering shorts, with stop-loss placements above the resistance areas and profit objectives aligned with support levels ($3,301 or near $3,300).
Trade active
gold sell now 3352Note
tp1 3325 done 270pips profit booked
Trade closed: target reached
tp2 hit 3314 done 370 pips profit done
Join My telegram channel Free:
t.me/tamesbulltarder139
💎
VIP Channels:
Forex:+400Pips & Crypto +420% monthly profit at VIP.
check pinned message in telegram for more information.
t.me/tamesbulltarder139
💎
VIP Channels:
Forex:+400Pips & Crypto +420% monthly profit at VIP.
check pinned message in telegram for more information.
Related publications
Disclaimer
The information and publications are not meant to be, and do not constitute, financial, investment, trading, or other types of advice or recommendations supplied or endorsed by TradingView. Read more in the Terms of Use.