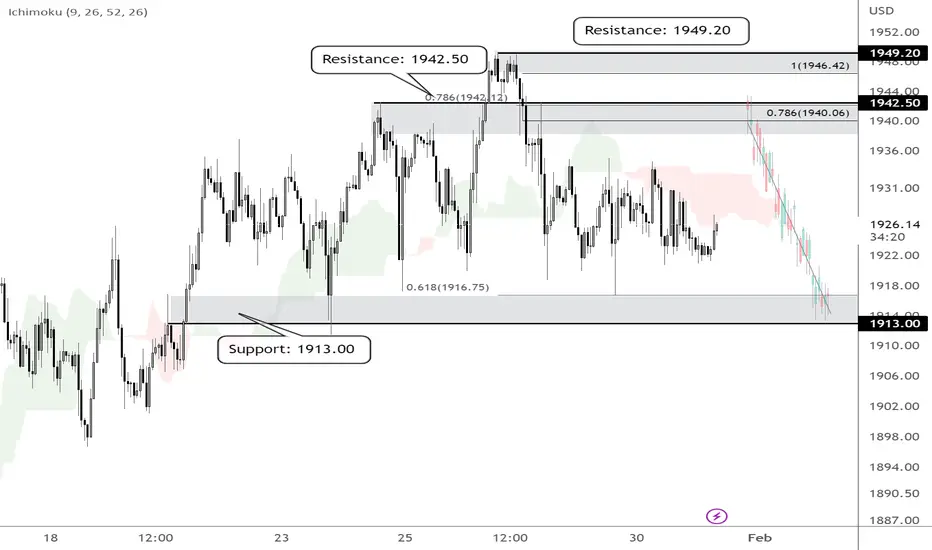
On the H1 time frame, prices are approaching the resistance zone at 1942.50, in line with the graphical resistance zone, 78.6% Fibonacci retracement and Fibonacci extension. We could see a reversal below this zone to the support zone at 1913.00, which coincides with the graphical support and 61.8% Fibonacci retracement. Prices are holding below the ichimoku cloud as well, supporting the bearish bias.
Disclaimer
The information and publications are not meant to be, and do not constitute, financial, investment, trading, or other types of advice or recommendations supplied or endorsed by TradingView. Read more in the Terms of Use.
Disclaimer
The information and publications are not meant to be, and do not constitute, financial, investment, trading, or other types of advice or recommendations supplied or endorsed by TradingView. Read more in the Terms of Use.