SMC trading point update
Technical analysis of XAU/USD (Gold Spot vs US Dollar) on the 1-hour timeframe. Here's a breakdown
---
Technical Breakdown:
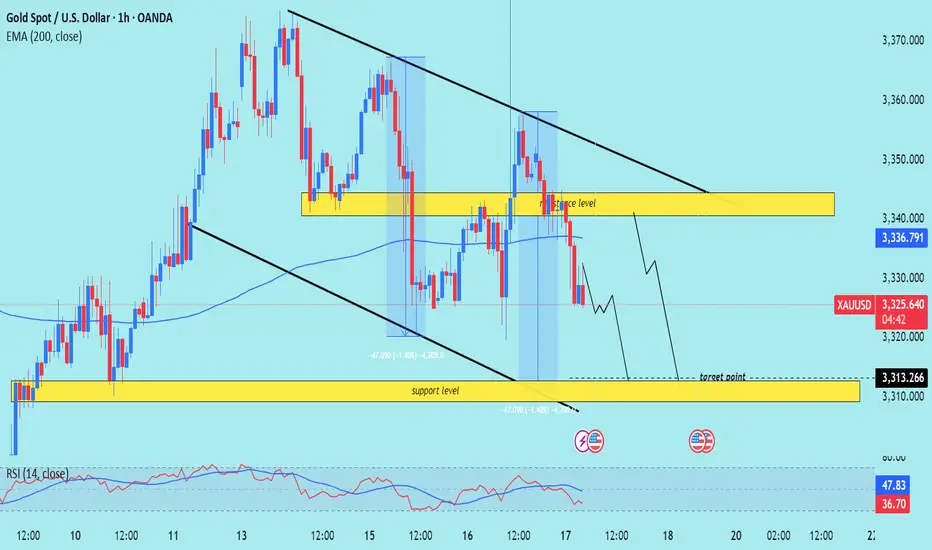
1. Descending Channel:
Price is trading within a clearly defined downward-sloping channel (black trendlines).
This suggests a short-term bearish trend.
2. Resistance Zone (Yellow Box at 3,335–3,340):
Price recently rejected from this resistance area.
This zone aligns with both the 200 EMA and previous structure, strengthening its validity.
3. EMA Confluence:
The 200 EMA (3,336.798) is acting as dynamic resistance.
Price is currently below the EMA, confirming the bearish bias.
4. Support/Target Zone:
The projected target zone is around 3,313.266, labeled as a support level.
This level has acted as previous structure support, increasing its significance.
5. RSI Analysis:
RSI is at 37.18, close to the oversold region, but not yet fully exhausted.
Suggests there’s still room for a downside move before any potential bounce.
Mr SMC Trading point
---
Trade Idea Summary:
Bias: Bearish
Entry: Below the resistance zone (~3,335–3,340)
Target: 3,313 (support zone)
Invalidation: Break and hold above 3,340–3,345
Risk Note: Watch for potential consolidation or fakeouts before continuation.
Please support boost 🚀 this analysis)
Technical analysis of XAU/USD (Gold Spot vs US Dollar) on the 1-hour timeframe. Here's a breakdown
---
Technical Breakdown:
1. Descending Channel:
Price is trading within a clearly defined downward-sloping channel (black trendlines).
This suggests a short-term bearish trend.
2. Resistance Zone (Yellow Box at 3,335–3,340):
Price recently rejected from this resistance area.
This zone aligns with both the 200 EMA and previous structure, strengthening its validity.
3. EMA Confluence:
The 200 EMA (3,336.798) is acting as dynamic resistance.
Price is currently below the EMA, confirming the bearish bias.
4. Support/Target Zone:
The projected target zone is around 3,313.266, labeled as a support level.
This level has acted as previous structure support, increasing its significance.
5. RSI Analysis:
RSI is at 37.18, close to the oversold region, but not yet fully exhausted.
Suggests there’s still room for a downside move before any potential bounce.
Mr SMC Trading point
---
Trade Idea Summary:
Bias: Bearish
Entry: Below the resistance zone (~3,335–3,340)
Target: 3,313 (support zone)
Invalidation: Break and hold above 3,340–3,345
Risk Note: Watch for potential consolidation or fakeouts before continuation.
Please support boost 🚀 this analysis)
Trade closed: target reached
(Services:✔️ JOIN Telegram channel
t.me/SMCTrading_point
Gold trading signals 🚀 99%
t.me/SMCTrading_point
Join my recommended broker , link 👇
World best broker exness ✅D
one.exnesstrack.org/a/l1t1rf3p6v
t.me/SMCTrading_point
Gold trading signals 🚀 99%
t.me/SMCTrading_point
Join my recommended broker , link 👇
World best broker exness ✅D
one.exnesstrack.org/a/l1t1rf3p6v
Related publications
Disclaimer
The information and publications are not meant to be, and do not constitute, financial, investment, trading, or other types of advice or recommendations supplied or endorsed by TradingView. Read more in the Terms of Use.