GOLD on the 1H time-frame.
Steps:
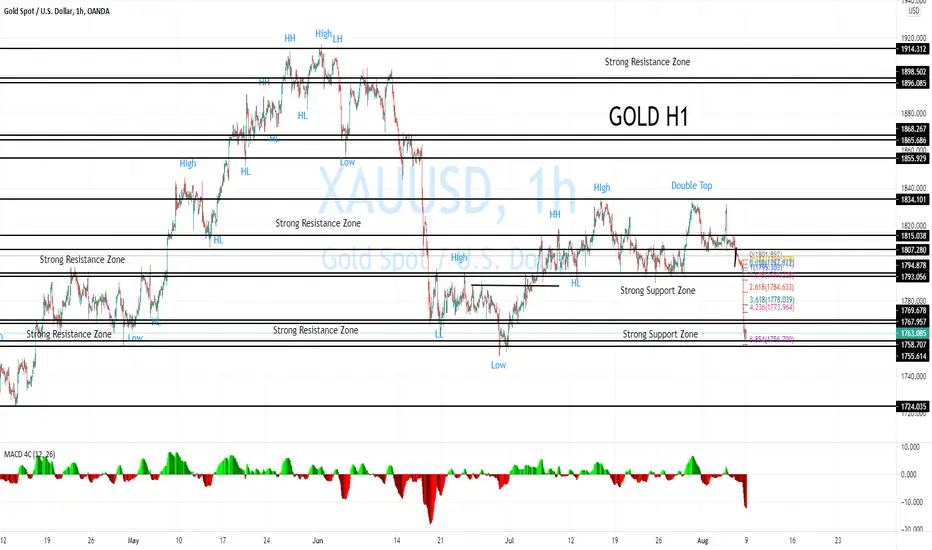
1. The price hit the target price at the Fibonacci level which is the same level of the strong support zone here at 1755 to 1758
2. The 1st scenario, the price create the reversal pattern here.
3. The 2nd scenario, the price breakout the support zone and go down to 1733 and 1723 accordingly.
Steps:
1. The price hit the target price at the Fibonacci level which is the same level of the strong support zone here at 1755 to 1758
2. The 1st scenario, the price create the reversal pattern here.
3. The 2nd scenario, the price breakout the support zone and go down to 1733 and 1723 accordingly.
Disclaimer
The information and publications are not meant to be, and do not constitute, financial, investment, trading, or other types of advice or recommendations supplied or endorsed by TradingView. Read more in the Terms of Use.
Disclaimer
The information and publications are not meant to be, and do not constitute, financial, investment, trading, or other types of advice or recommendations supplied or endorsed by TradingView. Read more in the Terms of Use.