Dear Trader,
✅ Symbol: Gold vs. US Dollar (XAUUSD)
✅ Timeframe: 4H
✅ Date: July 7, 2025
✅ Technical Overview:
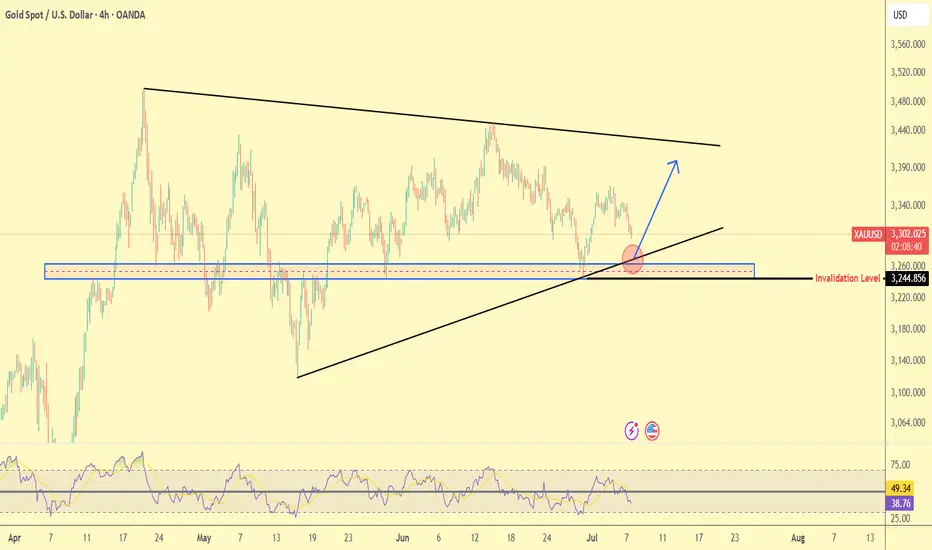
🔹 Price is forming a Symmetrical Triangle pattern.
🔹 A key support zone lies between $3245–3260, marked by the blue area.
🔹 Price has bounced from this zone and the ascending trendline (black), as shown by the red circle.
🔹 Main scenario: A potential bullish bounce toward the upper triangle resistance or even breakout (blue arrow).
🔻 Invalidation Level: $3,244.85
If this level breaks to the downside, the bullish setup will be invalidated, with possible targets at $3200 and $3100.
📉 RSI is currently between 38 and 49, not oversold yet, but near dynamic support.
✍️ Conclusion:
Holding above the current support area could trigger an upward move.
A break below $3245 would likely lead to further downside.
The current price area offers a favorable risk-reward for bullish positions.
Regards,
Alireza!
✅ Symbol: Gold vs. US Dollar (XAUUSD)
✅ Timeframe: 4H
✅ Date: July 7, 2025
✅ Technical Overview:
🔹 Price is forming a Symmetrical Triangle pattern.
🔹 A key support zone lies between $3245–3260, marked by the blue area.
🔹 Price has bounced from this zone and the ascending trendline (black), as shown by the red circle.
🔹 Main scenario: A potential bullish bounce toward the upper triangle resistance or even breakout (blue arrow).
🔻 Invalidation Level: $3,244.85
If this level breaks to the downside, the bullish setup will be invalidated, with possible targets at $3200 and $3100.
📉 RSI is currently between 38 and 49, not oversold yet, but near dynamic support.
✍️ Conclusion:
Holding above the current support area could trigger an upward move.
A break below $3245 would likely lead to further downside.
The current price area offers a favorable risk-reward for bullish positions.
Regards,
Alireza!
Trade active
💰MY FREE FOREX CRYPTO SIGNALS TELEGRAM CHANNEL: : t.me/Alirezaktrade
Disclaimer
The information and publications are not meant to be, and do not constitute, financial, investment, trading, or other types of advice or recommendations supplied or endorsed by TradingView. Read more in the Terms of Use.