XAU/USD (Gold vs. USD) chart structure
**Chart Overview**
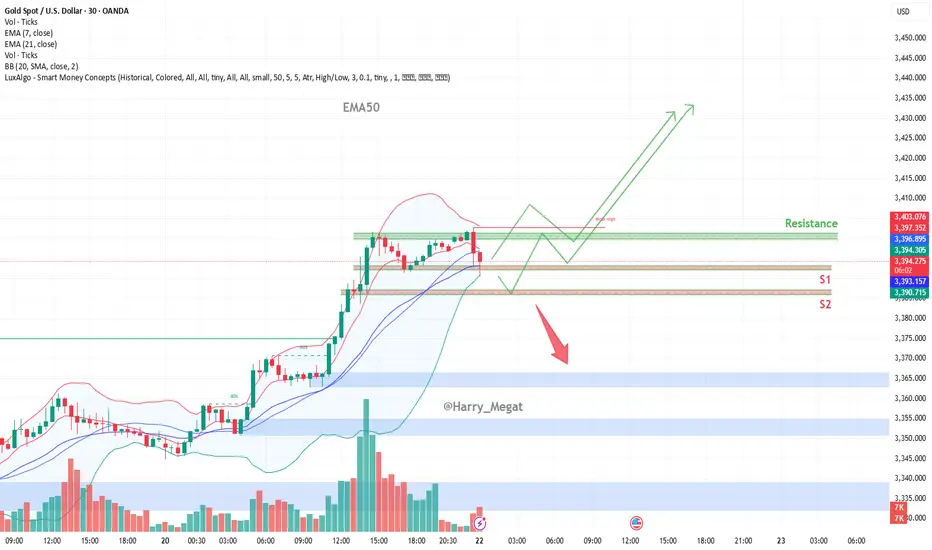
* **Current Price:** \~\$3,393
* **Indicators Used:**
* EMA 7, EMA 21 (short-term momentum)
* Bollinger Bands (20 SMA, 2 Std Dev)
* **Support Zones:**
* **S1:** \~\$3,392 – recent demand zone and confluence with EMAs
* **S2:** \~\$3,380 – deeper demand zone below
* **Resistance Zone:** \~\$3,403 – recent swing high and upper Bollinger Band
**Structure & Price Action Analysis**
**Bullish Impulse**
* A strong uptrend is visible prior to the current retracement, with consecutive higher highs and higher lows.
* Volume surged during the breakout around July 21, confirming strong bullish participation.
**Current Pullback**
* Price has rejected the **\$3,403 resistance**, causing a drop back to the **S1 demand zone**.
* This pullback is landing near the **EMA21 and lower Bollinger Band**, where buying interest may reappear.
**Possible Scenarios**
1. **Bullish Scenario (Green Path):**
* Price holds **above \$3,390–\$3,392 (S1)** support zone.
* Forms a **higher low** and reattempts a move toward **\$3,403** and potentially **\$3,420–\$3,435**.
* Confirmation: Bullish engulfing or reversal candles with volume near S1.
2. **Bearish Scenario (Red Arrow Path):**
* Price breaks below **S1 and EMA21**, losing bullish momentum.
* Next support is **S2 near \$3,380**, and if broken, it opens downside toward **\$3,365–\$3,350** zones
**Technical Confluence**
* **EMA Support:** EMA21 and EMA7 are still bullish-aligned but price is now testing them.
* **Bollinger Bands:** The price touched the upper band and is now mean-reverting. If it finds support at the midline or lower band, the bullish trend can continue.
* **Volume:** Volume spike during the breakout; recent drop is on lower volume, suggesting it may be just a pullback.
**Conclusion**
The structure remains bullish **as long as price stays above \$3,390/S1**. A bounce here could lead to continuation toward \$3,420+. However, **a break below \$3,390** may shift the structure toward bearish correction, targeting \$3,380 or lower.

**Chart Overview**
* **Current Price:** \~\$3,393
* **Indicators Used:**
* EMA 7, EMA 21 (short-term momentum)
* Bollinger Bands (20 SMA, 2 Std Dev)
* **Support Zones:**
* **S1:** \~\$3,392 – recent demand zone and confluence with EMAs
* **S2:** \~\$3,380 – deeper demand zone below
* **Resistance Zone:** \~\$3,403 – recent swing high and upper Bollinger Band
**Structure & Price Action Analysis**
**Bullish Impulse**
* A strong uptrend is visible prior to the current retracement, with consecutive higher highs and higher lows.
* Volume surged during the breakout around July 21, confirming strong bullish participation.
**Current Pullback**
* Price has rejected the **\$3,403 resistance**, causing a drop back to the **S1 demand zone**.
* This pullback is landing near the **EMA21 and lower Bollinger Band**, where buying interest may reappear.
**Possible Scenarios**
1. **Bullish Scenario (Green Path):**
* Price holds **above \$3,390–\$3,392 (S1)** support zone.
* Forms a **higher low** and reattempts a move toward **\$3,403** and potentially **\$3,420–\$3,435**.
* Confirmation: Bullish engulfing or reversal candles with volume near S1.
2. **Bearish Scenario (Red Arrow Path):**
* Price breaks below **S1 and EMA21**, losing bullish momentum.
* Next support is **S2 near \$3,380**, and if broken, it opens downside toward **\$3,365–\$3,350** zones
**Technical Confluence**
* **EMA Support:** EMA21 and EMA7 are still bullish-aligned but price is now testing them.
* **Bollinger Bands:** The price touched the upper band and is now mean-reverting. If it finds support at the midline or lower band, the bullish trend can continue.
* **Volume:** Volume spike during the breakout; recent drop is on lower volume, suggesting it may be just a pullback.
**Conclusion**
The structure remains bullish **as long as price stays above \$3,390/S1**. A bounce here could lead to continuation toward \$3,420+. However, **a break below \$3,390** may shift the structure toward bearish correction, targeting \$3,380 or lower.
Trade active
Gold (XAUUSD) has successfully hit the \$3,430 target, completing the bullish setup as anticipated — a strong move validating the prior breakout above key resistance levels. This marks a significant win, driven by safe-haven demand amid Fed uncertainty and global trade tensions.Trade closed: target reached
closeDisclaimer
The information and publications are not meant to be, and do not constitute, financial, investment, trading, or other types of advice or recommendations supplied or endorsed by TradingView. Read more in the Terms of Use.
Disclaimer
The information and publications are not meant to be, and do not constitute, financial, investment, trading, or other types of advice or recommendations supplied or endorsed by TradingView. Read more in the Terms of Use.