Gold technical chart, daily pressure 2040-2053, support below 2020-2000
Four-hour pressure 2034-40, support below 2029-2020
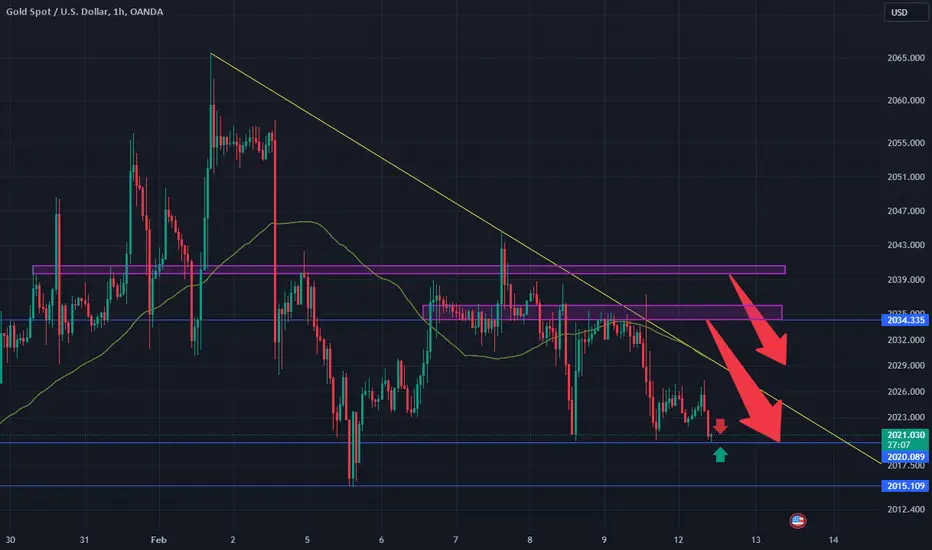
One-hour pressure is 2034, support below is 2020
Operational suggestions: Judging from the daily analysis, the short-term pressure at the top today will focus on around 2035-40, and the bottom will further test the strength of the support near 2020.
SELL:near 2040
SELL:near 2020
BUY:near 2010
BUY:near 2000

Four-hour pressure 2034-40, support below 2029-2020
One-hour pressure is 2034, support below is 2020
Operational suggestions: Judging from the daily analysis, the short-term pressure at the top today will focus on around 2035-40, and the bottom will further test the strength of the support near 2020.
SELL:near 2040
SELL:near 2020
BUY:near 2010
BUY:near 2000
Trade active
Trade active
After the support of 2000 falls below, if the market cannot rise sharply to repair the market today, it is expected to fall below 1972 in the near future. Whether it can fall below 1930 or 1860 is not yet concluded. It will take time to verify. There is a high probability of falling below 1972 based on the chart structure.💥Telegram Channel Free Updates 👉🏻
💥t.me/Actuary00group
✉️Signal and daily analysis channel
💥t.me/Actuary00group
✉️Signal and daily analysis channel
Related publications
Disclaimer
The information and publications are not meant to be, and do not constitute, financial, investment, trading, or other types of advice or recommendations supplied or endorsed by TradingView. Read more in the Terms of Use.
💥Telegram Channel Free Updates 👉🏻
💥t.me/Actuary00group
✉️Signal and daily analysis channel
💥t.me/Actuary00group
✉️Signal and daily analysis channel
Related publications
Disclaimer
The information and publications are not meant to be, and do not constitute, financial, investment, trading, or other types of advice or recommendations supplied or endorsed by TradingView. Read more in the Terms of Use.