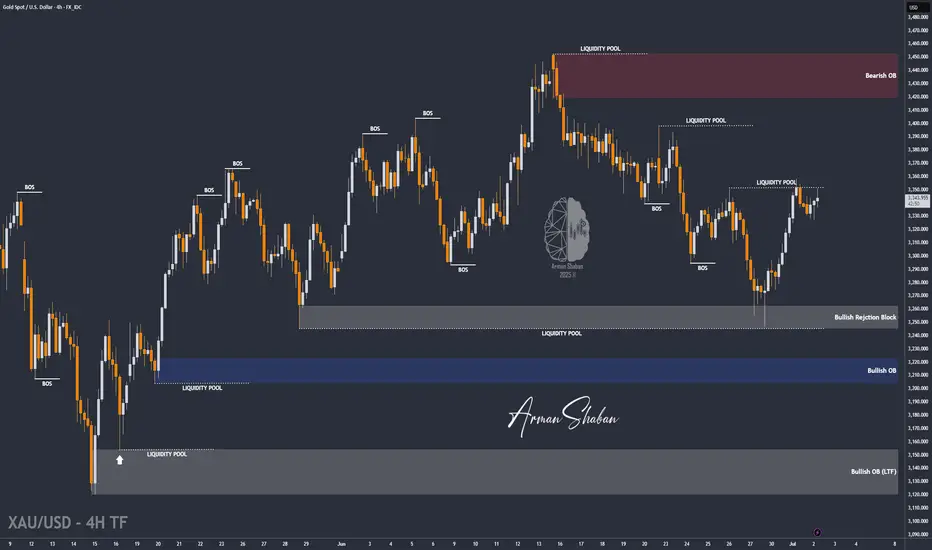
By analyzing the gold chart on the 4-hour timeframe, we can see that the price continued its correction yesterday, dropping to as low as $3327. However, gold rebounded and is currently trading around the $3344 level.
The key condition for further bullish movement is a stable hold above $3338. If this level holds, the next potential upside targets are $3366 and $3399 respectively.
Please support me with your likes and comments to motivate me to share more analysis with you and share your opinion about the possible trend of this chart with me !
Best Regards , Arman Shaban
Trade active
By analyzing the gold chart on the 4-hour timeframe, we can see that after dropping again to $3,338 today, the price faced strong demand and rebounded to $3,348.Given the current bullish momentum and price structure, we can still expect further upside for gold.
As mentioned in the previous analysis, the next potential bullish targets are $3,366 and $3,399.
⚜️ Free Telegram Channel : t.me/PriceAction_ICT
⚜️ JOIN THE VIP : t.me/PriceAction_ICT/5946
⚜️ Contact Me : t.me/ArmanShabanTrading
💥Join BitMart Exchange – Ultra Low Fees : bitmart.com/invite/c5JVJK/en-US
⚜️ JOIN THE VIP : t.me/PriceAction_ICT/5946
⚜️ Contact Me : t.me/ArmanShabanTrading
💥Join BitMart Exchange – Ultra Low Fees : bitmart.com/invite/c5JVJK/en-US
Related publications
Disclaimer
The information and publications are not meant to be, and do not constitute, financial, investment, trading, or other types of advice or recommendations supplied or endorsed by TradingView. Read more in the Terms of Use.