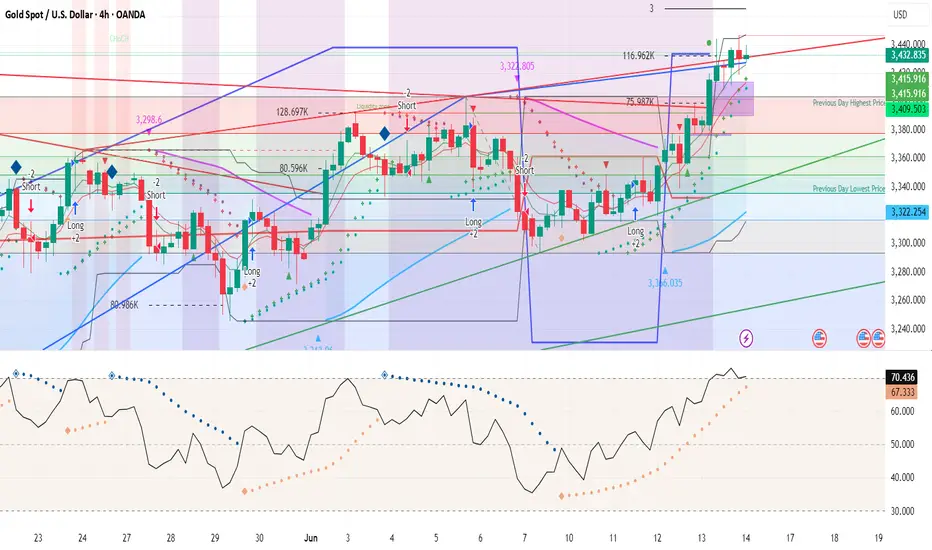
Based on the provided 4-hour timeframe chart for Gold (XAU/USD) from TradingView, published on June 15, 2025, here’s a technical analysis with the closing price at $3,434.55:
Price Action: The price is testing resistance near $3,434.55, aligning with the upper boundary of a consolidation zone between $3,326.035 and $3,434.55. A breakout above this level could target $3,452.982, while a failure may lead to a pullback.
Support and Resistance:
Support: Key support levels are at $3,326.035 and $3,260.560 (previous low).
Resistance: Immediate resistance is at $3,434.55, with further levels at $3,482.982 and $3,496.962.
Trend Indicators: The upward-sloping moving averages (e.g., 80.596K, 128.697K) suggest a medium-term bullish trend. The price is near the upper trendline, indicating potential overextension.
Trading Signals:
Long: Consider long positions if the price breaks and holds above $3,434.55 with strong volume.
Short: Short opportunities may emerge if the price rejects at $3,434.55 with bearish candlestick patterns (e.g., shooting star).
RSI: The RSI around 60-70 (based on the chart) indicates nearing overbought territory. A drop below 50 could signal a correction.
This analysis is based on the chart's visual data.https://tradingview.sweetlogin.com/chart/68iTGuqV/
Disclaimer
The information and publications are not meant to be, and do not constitute, financial, investment, trading, or other types of advice or recommendations supplied or endorsed by TradingView. Read more in the Terms of Use.
Disclaimer
The information and publications are not meant to be, and do not constitute, financial, investment, trading, or other types of advice or recommendations supplied or endorsed by TradingView. Read more in the Terms of Use.