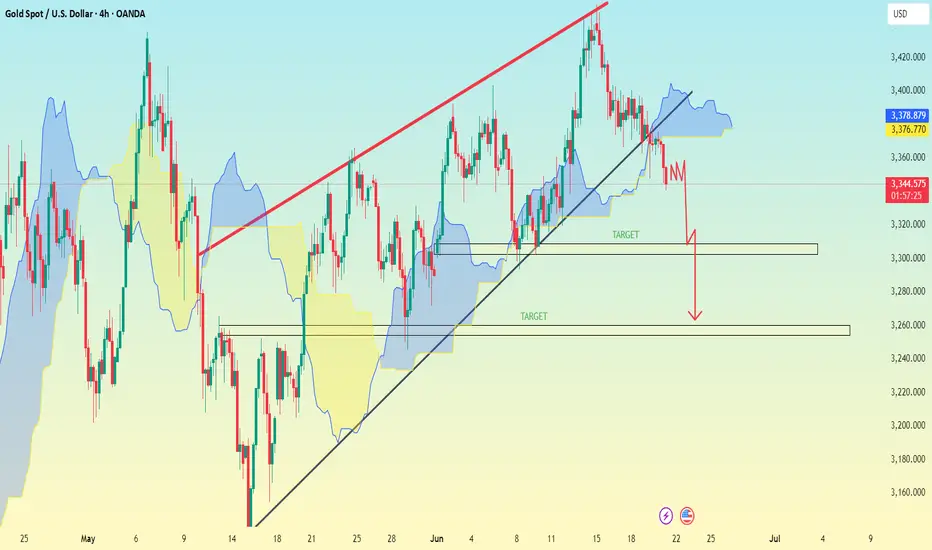
XAU/USD (Gold vs US Dollar) on the 4-hour timeframe, and it indicates a bearish breakdown from an ascending triangle or wedge pattern. The trendline has been broken, and the price has moved below the Ichimoku cloud, supporting a bearish outlook.
📉 Bearish Targets Identified:
1. First Target Zone (Minor Support):
Price Level: Around 3,300 – 3,310
This is the first horizontal support area after the breakdown.
2. Second Target Zone (Major Support):
Price Level: Around 3,250 – 3,260
This is the second marked target and more significant support zone based on past price action.
🔻 Summary:
Pattern: Rising wedge / ascending structure breakdown.
Breakdown Confirmed: Price below trendline and Ichimoku cloud.
Target 1: 3,300 – 3,310
Target 2: 3,250 – 3,260
Stop Loss (Suggested): Above 3,380 (cloud resistance / previous high).
Let me know if you'd like entry/SL/TP levels or a written analysis for posting.
t.me/forexofdollarsmagnet
Forex, gold and crypto signal's with detailed analysis & get consistent results..
t.me/Jhonscalpertrade11
Gold signal's with proper TP & SL for high profits opportunities..
Forex, gold and crypto signal's with detailed analysis & get consistent results..
t.me/Jhonscalpertrade11
Gold signal's with proper TP & SL for high profits opportunities..
Related publications
Disclaimer
The information and publications are not meant to be, and do not constitute, financial, investment, trading, or other types of advice or recommendations supplied or endorsed by TradingView. Read more in the Terms of Use.