Gold( XAUUSD) touched $3,337 as I expected in my previous idea.
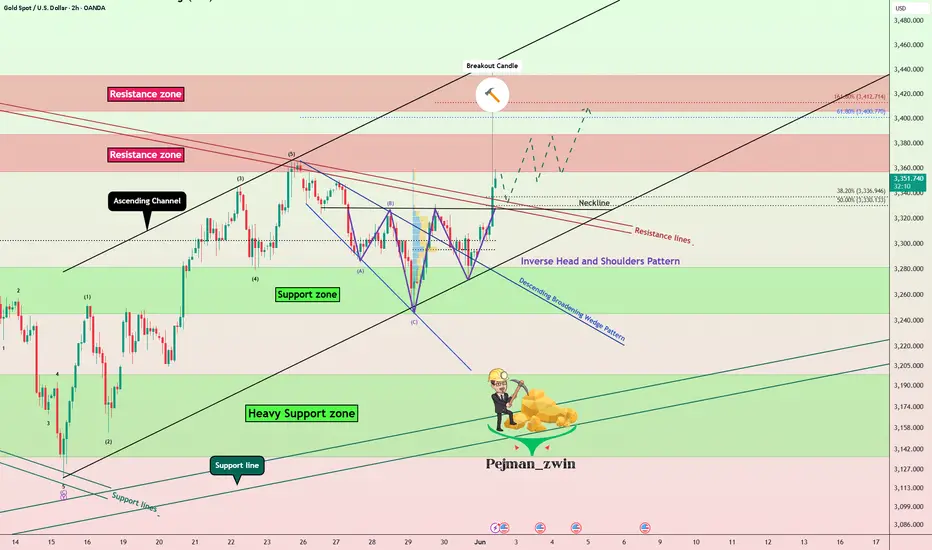
Gold has now managed to break the Resistance lines and is trying to break the Resistance zone($3,387-$3,357).
From a Classic Technical Analysis perspective, two Bullish Reversal Patterns are clearly visible on the Gold chart:
Also, given the increasing tension between Ukraine and Russia in recent days, there is a possibility that the price of Gold will increase due to the increased tensions.
I expect Gold to start rising again after a pullback to the neckline and resistance lines, and after breaking the Resistance zone($3,387-$3,357), to rise to the target I have indicated on the chart.
Note: If Gold touches $3,299[Worst Stop Loss(SL)], we should expect further declines.
Note: There is a possibility of emotional movements in the chart today when Fed Chair Powell speaks.
Gold Analyze ( XAUUSD ), 2-hour time frame.
Be sure to follow the updated ideas.
Do not forget to put a Stop loss for your positions (For every position you want to open).
Please follow your strategy; this is just my idea, and I will gladly see your ideas in this post.
Please do not forget the ✅' like'✅ button 🙏😊 & Share it with your friends; thanks, and Trade safe.
Gold has now managed to break the Resistance lines and is trying to break the Resistance zone($3,387-$3,357).
From a Classic Technical Analysis perspective, two Bullish Reversal Patterns are clearly visible on the Gold chart:
- Descending Broadening Wedge Pattern
- Inverse Head and Shoulders Pattern
Also, given the increasing tension between Ukraine and Russia in recent days, there is a possibility that the price of Gold will increase due to the increased tensions.
I expect Gold to start rising again after a pullback to the neckline and resistance lines, and after breaking the Resistance zone($3,387-$3,357), to rise to the target I have indicated on the chart.
Note: If Gold touches $3,299[Worst Stop Loss(SL)], we should expect further declines.
Note: There is a possibility of emotional movements in the chart today when Fed Chair Powell speaks.
Gold Analyze ( XAUUSD ), 2-hour time frame.
Be sure to follow the updated ideas.
Do not forget to put a Stop loss for your positions (For every position you want to open).
Please follow your strategy; this is just my idea, and I will gladly see your ideas in this post.
Please do not forget the ✅' like'✅ button 🙏😊 & Share it with your friends; thanks, and Trade safe.
Trade active
Position activated in Potential Reversal Zone(PRZ)
Trade closed: target reached
Targets Done
🎁Welcome than a 50% bonus(Low Spread)👉vtm.pro/Y3AV7r
🎁Get a 20% Discount on your trading FEE on BYBIT:👉partner.bybit.com/b/PEJMANZWIN
🎁Get a 20% Bonus & 30% Discount on LBANK exchange(NO KYC)👉lbank.one/join/uBythQd
🎁Get a 20% Discount on your trading FEE on BYBIT:👉partner.bybit.com/b/PEJMANZWIN
🎁Get a 20% Bonus & 30% Discount on LBANK exchange(NO KYC)👉lbank.one/join/uBythQd
Related publications
Disclaimer
The information and publications are not meant to be, and do not constitute, financial, investment, trading, or other types of advice or recommendations supplied or endorsed by TradingView. Read more in the Terms of Use.