🟠 Gold (XAUUSD) – 21 July Analysis | M15 Pullback in Bearish Trend
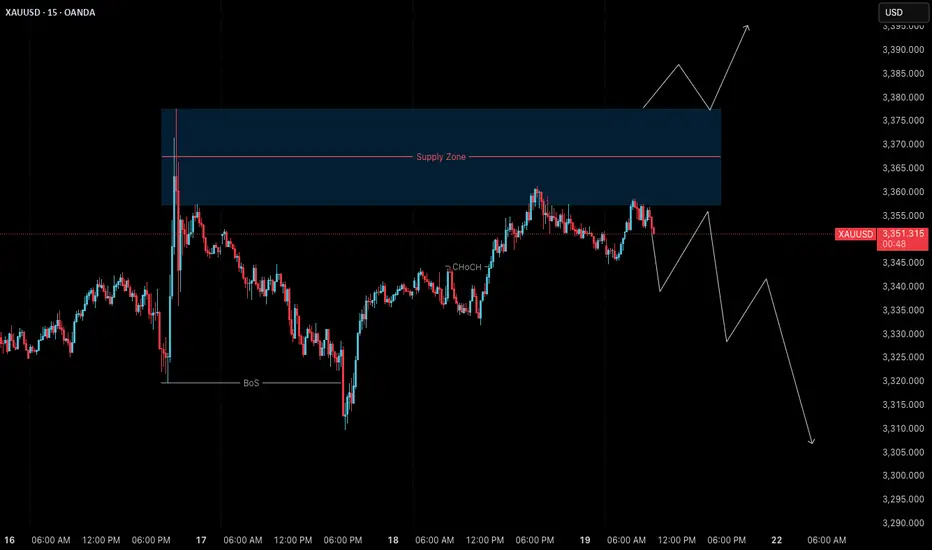
Gold is currently in a pullback phase within a bearish M15 trend.
The market structure is defined between the M15 lower high at 3377.650 and the previous low at 3310.
On Friday, price retested the M15 supply zone near the lower boundary, and again today, it has reacted from the same area. This repeated rejection suggests that sellers are still defending this level.
🔍 Trend Context:
– M15: Bearish (Lower High → Lower Low structure intact)
– H4: Currently in a pullback phase
Unless the price breaks above the key 3377.650 level, the bearish structure remains valid. As such, our directional bias continues to favour shorts.
🟥 Key Supply Zone: 3358–3377.650
– Recent rejections seen from this zone
– Acts as the active short-term supply zone
– Watching for internal M15 bearish shift for possible entry
Preferred Scenario:
As price has already retested the M15 supply zone, if we now see a downside shift in internal M15 structure (e.g., ChoCH + BoS), we will look for a potential short entry aligned with the dominant M15 trend.
No confirmation, no entry. Always follow structure.
Alternate Scenario:
If the market breaks above the 3377.650 lower high, it would signal a potential bullish structure shift. In that case, we will step back from the short bias and re-evaluate long opportunities accordingly.
📌 Trade Plan:
– Wait for M15 internal structure to shift (ChoCh) bearish, followed by a Break of Structure (BoS)
– On the retest, mark the Point of Interest (POI) for potential short setup
– Only act on confirmation (e.g., M1 ChoCH + BoS)
– SL: 40 pips | TP: 120 pips | Risk-Reward: Always 1:3
Summary:
– Gold is in a pullback phase within a bearish M15 trend
– Key levels to watch: 3377.650 (lower high) and 3310 (previous low)
– Bias remains bearish unless structure flips
– Watch for internal structure shift for short opportunity
– Stay patient and aligned with the dominant trend
📘 Shared by ChartIsMirror
Disclaimer
The information and publications are not meant to be, and do not constitute, financial, investment, trading, or other types of advice or recommendations supplied or endorsed by TradingView. Read more in the Terms of Use.
Disclaimer
The information and publications are not meant to be, and do not constitute, financial, investment, trading, or other types of advice or recommendations supplied or endorsed by TradingView. Read more in the Terms of Use.