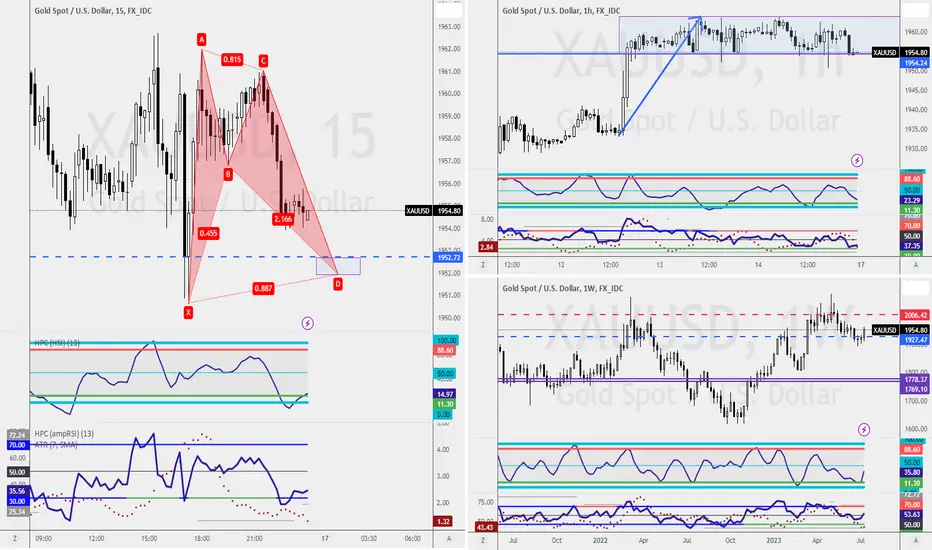
The weekly chart shows a solid support level at $1919.36 and resistance at $2016.26.
Excitingly, a Potential Bullish Flag Pattern on the 1-hourly chart signals a potential buying opportunity at $1954.80. Brace yourself for a substantial market movement! 🌟💰
Personally, I'm keeping an eye on a Bullish Fib-3 Bat Pattern forming at $1951.93, with a stop-loss set below $1949.10.
Remember, don't follow blindly—make your own trading decision. 🧠💼
🕒 15mins workday for Young Parents
🏦 Qualify Junior Analyst within 90days
🎤 Keynote Speaker
Get into our 15mins workday community
discord.gg/AKDr9vPqH7
Live session & Trading Tips on the GO
instagram.com/raynlim/
🏦 Qualify Junior Analyst within 90days
🎤 Keynote Speaker
Get into our 15mins workday community
discord.gg/AKDr9vPqH7
Live session & Trading Tips on the GO
instagram.com/raynlim/
Disclaimer
The information and publications are not meant to be, and do not constitute, financial, investment, trading, or other types of advice or recommendations supplied or endorsed by TradingView. Read more in the Terms of Use.