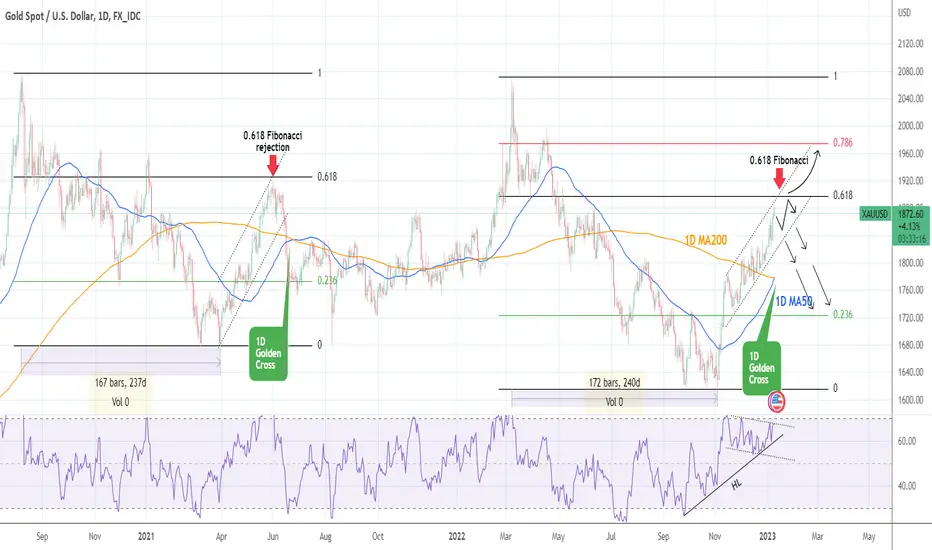
Gold formed today the first 1D Golden Cross since February 10th 2022, which led to the Ukraine/Russia war top. Based on the structre though (1D RSI = 67.910, MACD = 26.210, ADX = 46.359), it looks more similar to the Golden Cross of June 23rd 2021, which was also formed on a strong rally following a 240 day Bear Market.
During that past Golden Cross, the market was rejected just a few days before the formation on the 0.618 Fibonacci level and turned sideways for a long period of time until the war. Both led to the 0.618 within a Channel Up. At the moment the 0.618 Fib is at 1,898 and until it breaks, we shouldn't be very optimistic about today's Golden Cross, which is otherwise a bullish pattern.
If the 0.618 Fib breaks, we expect the Channel Up to target the next Fib level of 0.786 (1,974). If rejected and the price breaches below the Channel Down, the technical support is the 1D MA50 (blue) and the 0.236 Fib, which is where the 2021 pattern found the first support, is at 1,723.
It is important to also mention the 1D RSI pattern during that Channel Up, which is a Channel Down, i.e. a strong Bearish Divergence. The structure is so far supported by a Higher Lows formation started on the September 23rd Low. Hence breaking below can be the first sign of a pull back.
## If you like our free content follow our profile to get more daily ideas. ##
## Comments and likes are greatly appreciated. ##
## Also DONATIONS through TradingView coins help our cause of increasing the daily ideas put here for free and reach out more traders like you. ##
Telegram: t.me/investingscope
investingscope.com
Over 65% accuracy on Private Signals Channel.
Over 15% return monthly on our Account Management Plan.
Account RECOVERY services.
Free Channel: t.me/investingscopeofficial
investingscope.com
Over 65% accuracy on Private Signals Channel.
Over 15% return monthly on our Account Management Plan.
Account RECOVERY services.
Free Channel: t.me/investingscopeofficial
Disclaimer
The information and publications are not meant to be, and do not constitute, financial, investment, trading, or other types of advice or recommendations supplied or endorsed by TradingView. Read more in the Terms of Use.