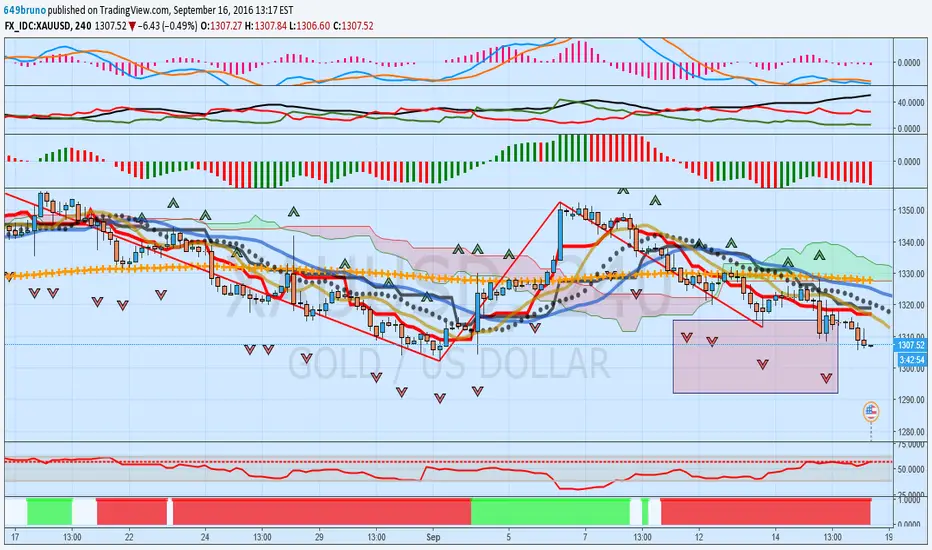
Upate from three days ago. XAUUSD-is still weak. It is down an additional 2% since then.
Here are ONE DOZEN negatives I see in-XAUUSD, and why I feel-Gold is a sell:
1. Multiple Sell Fractals in effect (red rectangle on chart).
2. Alligator jaws OPEN, feeding in down-trend. THIS IS YOUR DIRECTIONAL COMPASS.
3. Chop indicator (under chart) is in the shaded area. This indicates a ZERO trend and, at best, sloppy action with a downward bias.
4. Phase energy (lower top indicator) is heading LOWER. The action is below the zero line. Decidedly bearish .
5. DMI-(middle top indicator) has red (sell) as the dominant factor, and this bearish action is gaining strength as the (black) DMI-line rises.
6. Prices are trading BELOW the Ichimoku Cloud . This is a sell signal.
8. Prices are trading below the Ki jun-Sen baseline of the Ichimoku Cloud . This is a sell signal.
9. Prices are trading below the thick red Ichimoku Cloud conversion line. This is a sell signal.
9. The red Ichimoku Cloud conversion line direction is heading lower. This is a sell signal.
10. The Ki jun-Sen baseline of the Ichimoku Cloud direction is heading lower. This is a sell signal.
11. The CHOP ZONE indicator (under chart) is red, indicating a down trend.
12. 5/34 MACD (top) is heading lower.
My comments: very bearish signs. Decision: do not go long-XAUUSD. If you are short, maintain position.
Good luck to you. Don.
Disclaimer
The information and publications are not meant to be, and do not constitute, financial, investment, trading, or other types of advice or recommendations supplied or endorsed by TradingView. Read more in the Terms of Use.
Disclaimer
The information and publications are not meant to be, and do not constitute, financial, investment, trading, or other types of advice or recommendations supplied or endorsed by TradingView. Read more in the Terms of Use.