✅ Fundamental Analysis:
🔹 The United States and the European Union have reached a significant trade agreement, setting a unified tariff rate at 15% (previously threatened at 30%). The EU has also pledged to invest an additional $600 billion in the U.S. and to purchase $750 billion worth of American energy and military equipment.
🔹 This agreement has significantly eased trade tensions between the U.S. and EU, boosting market risk appetite and sending U.S. stock markets to new record highs. As a result, capital has shifted away from safe-haven assets like gold, causing gold prices to drop to the $3320 level during the Asian session.
✅ Technical Analysis:
🔸 4-Hour Chart:
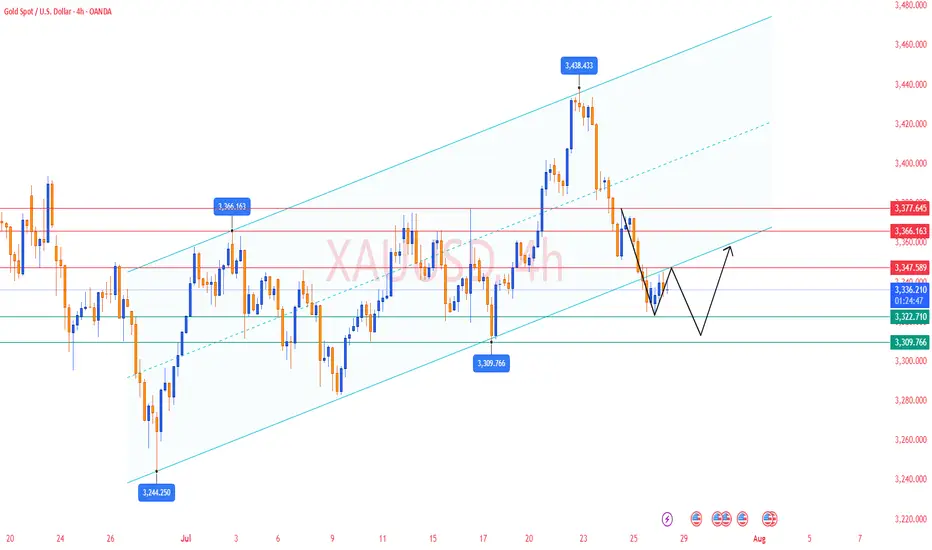
Since retreating from the 3438.77 high, gold has formed a clear descending channel. While the current candlestick shows some signs of stabilization near the lower Bollinger Band, the rebound has been weak and has yet to touch the middle band, suggesting the downtrend remains intact.
Moving averages are in a bearish alignment, with the MA5 crossing below the MA10, and price continues to trade below both—indicating ongoing bearish control.
If the price fails to reclaim the MA10 level around 3347, the structure will likely remain bearish, with further downside potential targeting the 3316 and 3309 support levels.
On the upside, the 3365–3380 zone represents key resistance. For the bulls to gain meaningful control, the price must break and hold above this area.
🔸 1-Hour Chart:
The overall trend remains bearish within a weak consolidation phase, with price hovering near the lower Bollinger Band.
Despite several attempts to rebound, gold has repeatedly failed to break above the 3350 level, which now acts as a key resistance line.
The Bollinger Bands have begun to flatten slightly, and if the price cannot hold above the 3345–3350 area, the risk of a renewed drop remains. Focus on the 3320–3317 support zone in the near term.
Overall, recent rebounds appear to be corrective in nature, and the 1-hour bearish structure remains unchanged.
🔴 Resistance Levels: 3345–3350 / 3365–3370
🟢 Support Levels: 3330–3325 / 3316–3309
✅ Trading Strategy Reference:
🔻 Short Position Strategy:
🔰Consider entering short positions in batches if gold rebounds to the 3350-3355 area. Target: 3330-3310;If support breaks, the move may extend to 3280.
🔺 Long Position Strategy:
🔰Consider entering long positions in batches if gold pulls back to the 3333-3338 area. Target: 3345-3355;If resistance breaks, the move may extend to 3365.
🔥Trading Reminder: Trading strategies are time-sensitive, and market conditions can change rapidly. Please adjust your trading plan based on real-time market conditions. If you have any questions or need one-on-one guidance, feel free to contact me🤝
✅𝐃𝐚𝐢𝐥𝐲 𝟐-𝟒 𝐓𝐫𝐚𝐝𝐢𝐧𝐠 𝐒𝐢𝐠𝐧𝐚𝐥𝐬🔥
✅𝐇𝐢𝐠𝐡 𝐀𝐜𝐜𝐮𝐫𝐚𝐜𝐲 𝟗𝟎%-𝟗𝟓% 🔥
✅𝐖𝐞𝐞𝐤𝐥𝐲 𝐲𝐢𝐞𝐥𝐝 𝟔𝟎%-𝟖𝟓%🔥
👉Free Channel:t.me/+bMC4JZq68qlhM2Q9
✉️VIP Guidance : t.me/Jack_blackwell
✅𝐇𝐢𝐠𝐡 𝐀𝐜𝐜𝐮𝐫𝐚𝐜𝐲 𝟗𝟎%-𝟗𝟓% 🔥
✅𝐖𝐞𝐞𝐤𝐥𝐲 𝐲𝐢𝐞𝐥𝐝 𝟔𝟎%-𝟖𝟓%🔥
👉Free Channel:t.me/+bMC4JZq68qlhM2Q9
✉️VIP Guidance : t.me/Jack_blackwell
Disclaimer
The information and publications are not meant to be, and do not constitute, financial, investment, trading, or other types of advice or recommendations supplied or endorsed by TradingView. Read more in the Terms of Use.