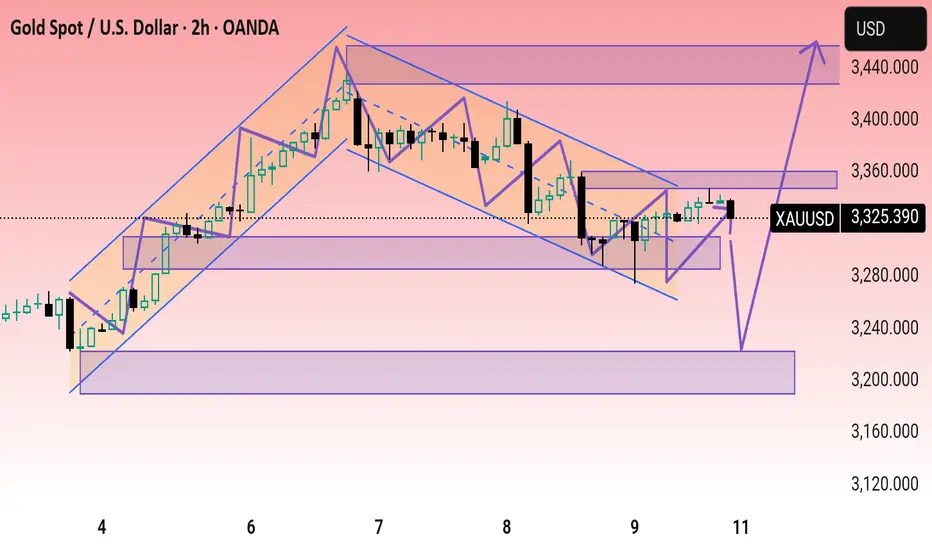
This is a 2-hour candlestick chart for Gold Spot against the U.S. Dollar (XAU/USD), published on TradingView. Here's a breakdown of the technical details and indications:
Chart Overview
Current Price: $3,325.390
Change: +19.410 (+0.59%)
Technical Patterns & Analysis
1. Uptrend Channel (Early May):
A bullish channel was formed between May 3–6.
Price moved steadily upwards within this channel, supported by higher lows and higher highs.
2. Descending Channel (Correction):
Starting around May 6–7, a descending parallel channel appeared, indicating a correction or consolidation phase.
3. Wedge & Breakout Zone:
Within the descending channel, a falling wedge pattern was identified, potentially a bullish reversal pattern.
The breakout of the wedge to the upside indicates a bullish signal.
4. Support & Resistance Zones:
Support Zone: Around the $3,200 mark—highlighted by a purple box, suggesting a strong demand area.
Immediate Resistance: Just above the $3,325 price level.
Target Resistance Zone: Around $3,400—highlighted with an arrow, suggesting the next major target if the bullish move continues.
5. Potential Price Path:
The chart suggests two potential scenarios:
A bullish continuation toward $3,400 after consolidating around current levels.
A possible pullback to the $3,200 support zone before resuming upward momentum.
Would you like an interpretation of this chart from a trader’s perspective (e.g., possible entries, stop-loss, targets)?
Disclaimer
The information and publications are not meant to be, and do not constitute, financial, investment, trading, or other types of advice or recommendations supplied or endorsed by TradingView. Read more in the Terms of Use.
Disclaimer
The information and publications are not meant to be, and do not constitute, financial, investment, trading, or other types of advice or recommendations supplied or endorsed by TradingView. Read more in the Terms of Use.