XAUUSD (Gold/USD) 1-hour chart
Key Elements on the Chart
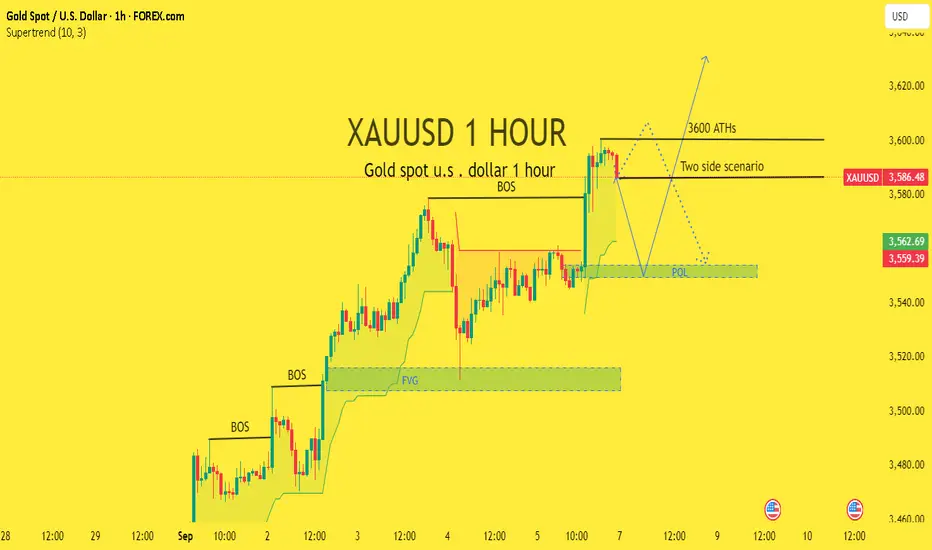
1. Price Level:
Current price around $3,586.48.
2. Imprtant Zones/Markings:
3600 ATHs (All-Time High Supply Area): Resistance near $3,600.
Two-side scenario line: Neutral pivot zone near $3,586–3,590.
POL (Point of Liquidity) around $3,550–3,560: A demand zone where liquidity might rest.
BOS (Break of Structure): Shown multiple times, confirming bullish structure breaks.
FVG (Fair Value Gap): Below, around $3,500–3,520.
Scenario Analysis
The chart is showing two possible scenarios:
Bullish Case
If price breaks above $3,600 ATHs, continuation towards $3,620+ is possible.
Market structure remains bullish with BOS confirmations.
Bearish Case
If price fails at $3,600 and rejects, it could drop:
First stop → $3,560–3,562 liquidity zone
If broken, deeper retracement into the Fair Value Gap $3,500–3,520.
Bullish bias above $3,562 (target $3,600 → $3,620).
Bearish bias if candle closes below $3,560 (target $3,520 zone).
Key Elements on the Chart
1. Price Level:
Current price around $3,586.48.
2. Imprtant Zones/Markings:
3600 ATHs (All-Time High Supply Area): Resistance near $3,600.
Two-side scenario line: Neutral pivot zone near $3,586–3,590.
POL (Point of Liquidity) around $3,550–3,560: A demand zone where liquidity might rest.
BOS (Break of Structure): Shown multiple times, confirming bullish structure breaks.
FVG (Fair Value Gap): Below, around $3,500–3,520.
Scenario Analysis
The chart is showing two possible scenarios:
Bullish Case
If price breaks above $3,600 ATHs, continuation towards $3,620+ is possible.
Market structure remains bullish with BOS confirmations.
Bearish Case
If price fails at $3,600 and rejects, it could drop:
First stop → $3,560–3,562 liquidity zone
If broken, deeper retracement into the Fair Value Gap $3,500–3,520.
Bullish bias above $3,562 (target $3,600 → $3,620).
Bearish bias if candle closes below $3,560 (target $3,520 zone).
Trade closed: target reached
Congratulations guys our buy side chart analysis has been hit with along 370 pips moves in buy positionBest Analysis xauusd single
t.me/+uAIef7IqwSs4M2Q0
VIP PREMIMUM ANALYSIS ROOM SIGNALS
t.me/+uAIef7IqwSs4M2Q0
t.me/+uAIef7IqwSs4M2Q0
VIP PREMIMUM ANALYSIS ROOM SIGNALS
t.me/+uAIef7IqwSs4M2Q0
Disclaimer
The information and publications are not meant to be, and do not constitute, financial, investment, trading, or other types of advice or recommendations supplied or endorsed by TradingView. Read more in the Terms of Use.
Best Analysis xauusd single
t.me/+uAIef7IqwSs4M2Q0
VIP PREMIMUM ANALYSIS ROOM SIGNALS
t.me/+uAIef7IqwSs4M2Q0
t.me/+uAIef7IqwSs4M2Q0
VIP PREMIMUM ANALYSIS ROOM SIGNALS
t.me/+uAIef7IqwSs4M2Q0
Disclaimer
The information and publications are not meant to be, and do not constitute, financial, investment, trading, or other types of advice or recommendations supplied or endorsed by TradingView. Read more in the Terms of Use.