🔍 Momentum:
D1 timeframe: Momentum is currently rising, suggesting that the bullish trend is likely to continue for the next few days.
H4 timeframe: Momentum is also bullish, indicating that the uptrend is likely to dominate today.
🌀 Elliott Wave Pattern:
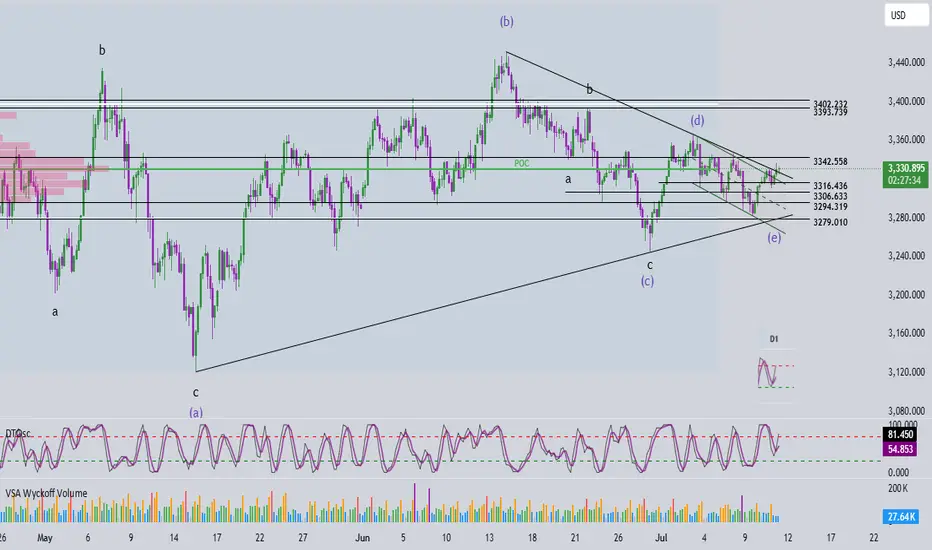
On the H4 chart, price action is in the final stage of a contracting triangle correction.
Price is now approaching the upper boundary of the triangle. With both D1 and H4 momentum in alignment, the probability of a breakout to the upside is high.
If this breakout occurs, we can expect a move toward the 3393 area, which is a key level to confirm whether the corrective phase has truly ended.
🎯 Price Targets:
Current area (3330–3332): A potential opportunity for a scalp BUY, supported by bullish momentum on H4.
Next support zone: 3315–3317 – a solid area for a mid-term BUY entry if there’s a pullback.
⚠️ If price breaks below 3279, the current wave count becomes invalid and a new analysis will be provided.
✅ Trade Plan:
🔹 SCALP BUY
Entry: 3332 – 3330
SL: 3327
TP1: 3363
TP2: 3390
🔹 MID-TERM BUY ZONE
Entry: 3317 – 3315
SL: 3307
TP1: 3342
TP2: 3363
TP3: 3390
Trade active
+ 100 pips Entry BUY 3332 - 3330Trade closed: target reached
+ 200 pips Entry 3332 - 3330👉 Join the channel to receive more scalping signals!
Channel Telegram: t.me/+XkFQ95yHVOEwNDc1
Channel Telegram: t.me/+XkFQ95yHVOEwNDc1
Related publications
Disclaimer
The information and publications are not meant to be, and do not constitute, financial, investment, trading, or other types of advice or recommendations supplied or endorsed by TradingView. Read more in the Terms of Use.
👉 Join the channel to receive more scalping signals!
Channel Telegram: t.me/+XkFQ95yHVOEwNDc1
Channel Telegram: t.me/+XkFQ95yHVOEwNDc1
Related publications
Disclaimer
The information and publications are not meant to be, and do not constitute, financial, investment, trading, or other types of advice or recommendations supplied or endorsed by TradingView. Read more in the Terms of Use.