Analysis of key factors
Risk aversion subsides: The call between the Chinese and US heads of state released a signal of trade easing, weakening the demand for gold as a safe haven, causing the gold price to rise and then fall (3403→3335).
Fed policy expectations: Inflationary pressure may prompt the Fed to maintain high interest rates, suppressing the upside of gold, but economic uncertainty still provides support.
Technical shock pattern: The daily line alternates between positive and negative, showing a tug-of-war between bulls and bears. 3405-3300 becomes the short-term key range.
Technical analysis
Daily level:
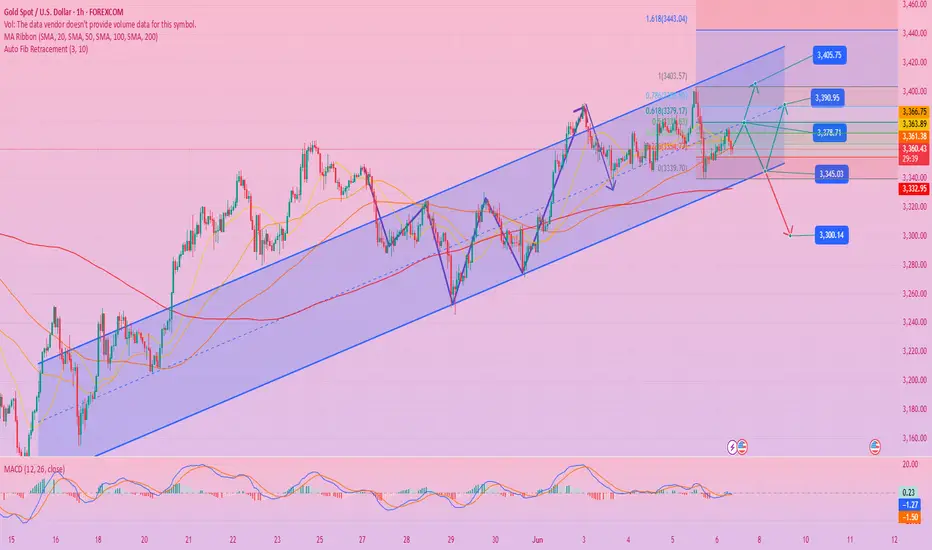
Form: On Thursday, it rose and fell back to close in the negative, falling below the 5-day moving average, but the slight increase during the day showed buying support.
Key position: 3405 above (previous high/resistance), 3330-3300 below (support area).
Trend: Maintain range shocks, need to break through 3405 or break below 3300 to choose the direction.
4-hour level:
Interval convergence: 3385-3335 is the main fluctuation range of the Asian and European sessions, and short-term trading can be high-short and low-long.
Long-short watershed: 3385 breaks through and tests 3405, and 3335 breaks down and looks at 3300.
Trading strategy
Asian and European sessions (short-term):
Long strategy: light long positions in the 3350-3342 area, stop loss below 3335, target 3370-3385.
Short strategy: short short near the rebound of 3385, stop loss above 3400, target 3350-3335.
US session/trend (breakthrough confirmation required):
Break above 3385: follow up long orders, target 3405, and hold cautiously after the breakthrough.
Break below 3335: follow the trend and go short, target 3310-3300, pay attention to take profit at low level.
Risk Warning
Impact of non-agricultural data: If the data deviates greatly from expectations, it may cause violent fluctuations, but the probability of a high rise and fall is expected to be high.
News tracking: Pay attention to the progress of Sino-US trade and the speeches of Federal Reserve officials. Any unexpected news may break the shock pattern.
Operational suggestions: Sell high and buy low in the current range, strictly stop loss, and avoid chasing ups and downs. Conservative investors should wait for the area around 3300 to arrange medium- to long-term long positions, or follow up after an effective breakthrough of 3405.
Trade active
Analysis of the latest trend of gold:
Analysis of key factors
The core logic of the long-short game
Risk of inducing longs: The daily high negative line + breaking the 5-day moving average, with the easing of geopolitical tensions and the cooling of trade risks, there are obvious signs of long profit-taking, and we need to be vigilant against high-level reversals.
Moving average system: The 10-day moving average (3333) has become the short-term lifeline. If it is lost, it may accelerate the decline to the 3300-3324 support area; if it is held, it will maintain volatility (3330-3370).
Technical indicator signal
30-minute cycle: The moving average diverges downward and has a potential dead cross. If MACD returns to below the zero axis, it will strengthen the short-term short momentum.
Fibonacci key positions: 3372 (0.5) and 3379 (0.618) are rebound resistance, 3330-3339 is the first support band, and 3324 (top and bottom conversion) is the second line of defense.
Pattern and volume price
The initial form of the dark cloud cover: the daily big negative line engulfs the previous day's gains. If it closes below 3330 on Friday, the bearish pattern is confirmed, and the target is 3300.
Volume coordination: If the decline yesterday is accompanied by an increase in positions, it indicates that the shorts are dominant; otherwise, it may be a wash-out by the main funds.
Time-sharing trading strategy
Scenario 1: Opportunity to short on rebound
Trigger conditions: The price rebounds to the 3345-3365 range (especially 3372-3379), and the 30-minute K-line shows stagflation signals (such as pin bar, engulfment).
Stop loss setting: above 3380 (if it breaks through 0.618 of yesterday's decline, the short order will be invalid).
Target position: 3333→3324→3310.
Scenario 2: Opportunity to chase short positions
Trigger conditions: The 30-minute entity falls below 3330, and the moving average crosses and confirms.
Stop loss setting: 3340 (previous low turns into resistance).
Target: 3324→3300 (psychological barrier).
Scenario 3: Defensive long positions
Trigger conditions: Rapidly drop to 3310-3300 area with long lower shadow or RSI oversold (<30).
Stop loss setting: 3295 (below the previous low).
Target: 3330 (short-term arbitrage).
Key risk reminder
Geopolitical repetition: If the situation in the Middle East or Russia and Ukraine suddenly escalates, gold may quickly rise and break through 3380, and short positions need to be stopped in time.
Liquidity trap: Volatility may narrow during the Asian session, and false breakthroughs need to be vigilant. It is recommended to wait for the European session to open to confirm the direction.
Summary
Short-term tendency: Technically, shorts are dominant, but be wary of long resistance in the 3300-3330 area.
Operation priority:
Arrange short positions in batches after rebounding to above 3350 (best cost-effectiveness).
After breaking below 3330, light positions chase shorts (need to stop profit quickly).
Speculation rebound around 3300 (for aggressive investors only).
Trade closed: target reached
Analysis and strategy of the latest gold trend on June 9:
Core logic analysis:
Risk aversion cools down
The easing of Sino-US trade tensions weakens the short-term safe-haven demand for gold, but long-term uncertainties (such as the prospects for global economic recovery and the Fed's policies) still support the safe-haven properties of gold.
Technical bearishness dominates
Weekly: Inverted hammer pattern + MACD high dead cross sign, suggesting a callback risk.
Daily: Two consecutive negatives fell below the short-term moving average, MACD dead cross, but be wary of the support strength of the Bollinger middle track (near 3295).
4 hours: The price broke below the Bollinger lower track, the moving average was in a short position, the MACD momentum was downward, and the short-term was bearish.
Key price:
Upper resistance:
First resistance: 3328-3330 (intraday strength and weakness boundary, bearish force point).
Strong resistance: 3345-3350 (if broken, the short-term bearish trend may be reversed).
Support below:
First support: 3290-3280 (test target at the beginning of the week, may trigger a rebound).
Strong support: 3280 (break opens the downward space to 3250-3230).
Operation strategy suggestions
Short order opportunity
Aggressive: short with a light position after rebounding to 3325-3330, stop loss above 3340, target 3300-3290.
Conservative: wait for the 3340-3345 area to be under pressure before entering the market, stop loss 3355, target the same as before.
Long order opportunity
Short-term rebound: If it first touches 3280-3290 and stabilizes (not breaking down quickly), you can go long with a light position on the rebound, stop loss 3275, target 3310-3320.
Rebound after breaking: If it quickly breaks down 3280 and rebounds to 3295-3300 under pressure, you can follow the short position for the second time.
Breakout response
Break above 3350: Short orders temporarily exit the market, wait and see whether it will step back to confirm the support and turn long.
Break below 3275: Be cautious in chasing shorts, prevent low-level technical rebounds, and wait for a pullback before following up with shorts.
Risk warning
Data risk: Market volatility may increase before and after the release of non-agricultural data, and be wary of wash-outs.
Sudden events: Sudden changes in geopolitical or Fed policy expectations may reverse technical patterns.
Position management: The current trend is bearish but has not been confirmed to be unilateral. It is recommended to operate with light positions in stages to avoid heavy positions betting on the direction.
Summary: Gold is likely to continue to fluctuate and be bearish next week, but be wary of bullish counterattacks at key support levels. The main trading method is shorting at the rebound high point, supplemented by short buying at the key support level, strictly stop loss and pay attention to the news developments.
Related publications
Disclaimer
The information and publications are not meant to be, and do not constitute, financial, investment, trading, or other types of advice or recommendations supplied or endorsed by TradingView. Read more in the Terms of Use.
Related publications
Disclaimer
The information and publications are not meant to be, and do not constitute, financial, investment, trading, or other types of advice or recommendations supplied or endorsed by TradingView. Read more in the Terms of Use.