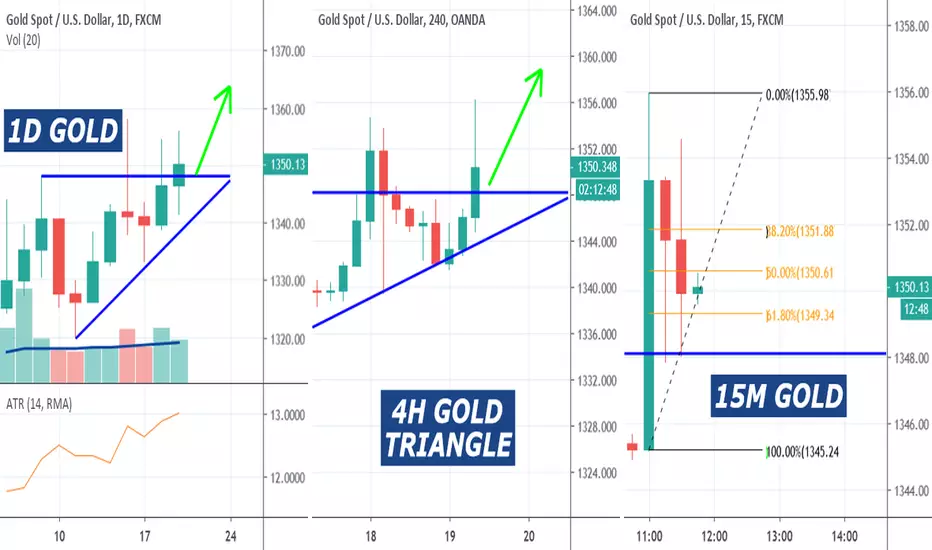
Day chart shows ascending triangle chart pattern - bullish bias
1H chart shows failed bullish breakout - price re-entered triangle pattern - bounces off bottom -breaks top
15m chart with fib shows an entry point - you choose
Tell us what SL & TP yu want to choose in the comment section below
We are doing a live triangle trading class on our TTT Strategy June 25th @ 2PM ET! If you are interested in learning more about it, please visit the link you see below in our signature. Thanks!
Note
15m 50% fib level entry pointNote
1st TP hit from 15m fib extention level2nd trade running possible target of -127.20
Note
When would you have exited?Disclaimer
The information and publications are not meant to be, and do not constitute, financial, investment, trading, or other types of advice or recommendations supplied or endorsed by TradingView. Read more in the Terms of Use.
Disclaimer
The information and publications are not meant to be, and do not constitute, financial, investment, trading, or other types of advice or recommendations supplied or endorsed by TradingView. Read more in the Terms of Use.