📉 XAUUSD 4H Chart – Bearish Flag Pattern Analysis
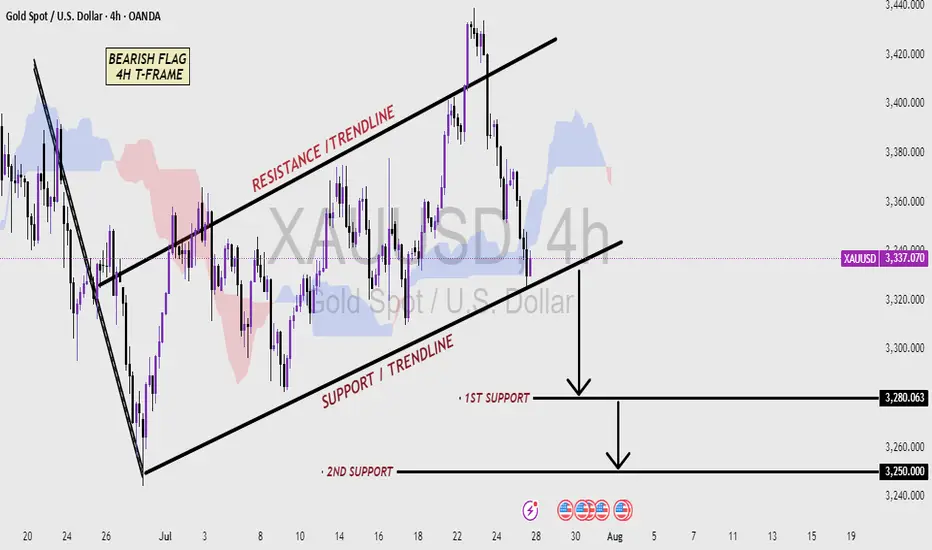
This 4-hour chart of Gold (XAUUSD) shows a classic Bearish Flag pattern, which is typically a continuation signal in a downtrend. After a strong bearish move, price entered a consolidation phase inside a rising channel, forming higher highs and higher lows—this creates the flag structure.
The price is currently trading within the Resistance and Support Trendlines of the flag. A break below the Support Trendline would confirm the bearish flag breakout, suggesting a continuation of the downtrend.
Key support levels to watch:
🔻 First Support: 3280.063 – Initial target after breakout
🔻 Second Support: 3250.000 – Extended target if bearish momentum continues
Traders should monitor for a confirmed breakdown with volume and bearish candlestick confirmation to validate short entries. This setup favors sellers if the support breaks decisively.
Trade active
Trade Active 📉XAUUSD has broken below the support trendline, confirming a bearish flag pattern on the 4H timeframe. The move indicates selling pressure, with price heading toward the first support at 3301, followed by potential drops to 3280 and 3250. Traders should monitor price action closely as the bearish momentum continues to unfold.
Note
Update 📉 XAUUSD✅ First Support 3301 Hit
✅ Second Support 3280 Also Reached
Bearish momentum is playing out perfectly as expected after the trendline breakdown. Market respecting the bearish flag structure — now approaching final support levels. Stay alert for further price action!
📈 For More Setups & Updates —
🚀 Join our Telegram Channel!
👉 t.me/+vWVmX9cov69kNTU1
Step Into the Winners' Circle — Join Our VIP Signals Group Now!
t.me/+nnIo1DeoMLE5NjY0
🚀 Join our Telegram Channel!
👉 t.me/+vWVmX9cov69kNTU1
Step Into the Winners' Circle — Join Our VIP Signals Group Now!
t.me/+nnIo1DeoMLE5NjY0
Related publications
Disclaimer
The information and publications are not meant to be, and do not constitute, financial, investment, trading, or other types of advice or recommendations supplied or endorsed by TradingView. Read more in the Terms of Use.