XAU/USD Bearish Rejection at Resistance – Potential Drop Ahead! 💥
🔍 Technical Analysis:
Instrument: Gold vs US Dollar (XAU/USD)
Timeframe: Daily
Current Price: $3,363.26
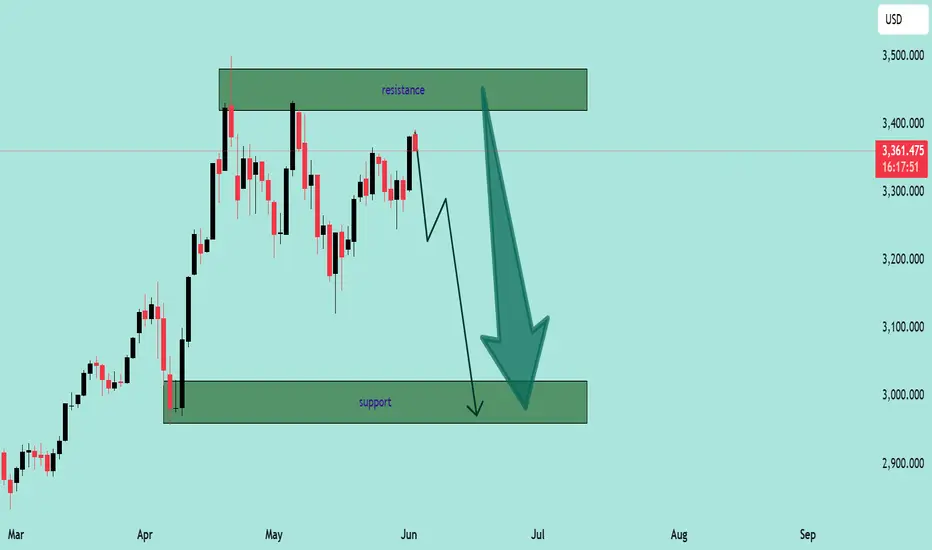
Resistance Zone: $3,380 – $3,470
Support Zone: $2,970 – $3,100
🧠 Market Context:
Gold has recently approached a well-defined resistance zone near the $3,380–$3,470 range. Price action shows multiple rejection wicks and failed attempts to break above this level, indicating strong selling pressure from bears. 🐻
The current candlestick structure suggests the market is printing lower highs, which may indicate a transition from a consolidation phase into a potential bearish trend.
📉 Projection:
The chart projects a move down toward the support zone, around $2,970–$3,100, possibly due to:
Repeated rejections at the resistance zone 🔄
Lack of bullish momentum near highs ⚠️
Bearish engulfing or reversal candlestick formations 🔻
✅ Key Levels to Watch:
Level Type Price Zone Action
🔴 Resistance $3,380 – $3,470 Strong rejection expected
🟢 Support $2,970 – $3,100 Major demand zone; potential bounce
🧭 Trading Outlook:
⚠️ If price fails to break above the resistance zone, short opportunities may develop with a target near the support zone. A confirmed break and close below $3,300 would strengthen bearish sentiment.
📌 Bearish Bias Maintained Until Resistance Breaks
🔍 Technical Analysis:
Instrument: Gold vs US Dollar (XAU/USD)
Timeframe: Daily
Current Price: $3,363.26
Resistance Zone: $3,380 – $3,470
Support Zone: $2,970 – $3,100
🧠 Market Context:
Gold has recently approached a well-defined resistance zone near the $3,380–$3,470 range. Price action shows multiple rejection wicks and failed attempts to break above this level, indicating strong selling pressure from bears. 🐻
The current candlestick structure suggests the market is printing lower highs, which may indicate a transition from a consolidation phase into a potential bearish trend.
📉 Projection:
The chart projects a move down toward the support zone, around $2,970–$3,100, possibly due to:
Repeated rejections at the resistance zone 🔄
Lack of bullish momentum near highs ⚠️
Bearish engulfing or reversal candlestick formations 🔻
✅ Key Levels to Watch:
Level Type Price Zone Action
🔴 Resistance $3,380 – $3,470 Strong rejection expected
🟢 Support $2,970 – $3,100 Major demand zone; potential bounce
🧭 Trading Outlook:
⚠️ If price fails to break above the resistance zone, short opportunities may develop with a target near the support zone. A confirmed break and close below $3,300 would strengthen bearish sentiment.
📌 Bearish Bias Maintained Until Resistance Breaks
Trade active
JOIN MY TELEGRAM CHANNEL
t.me/StellarMarketAnalysis
JOIN MY RECOMMENTED BROKER REFFREL LINK
⤵️one.exnesstrack.net/a/uvd1etcgg1
PARTNER CODE⤵️
uvd1etcgg1
t.me/StellarMarketAnalysis
JOIN MY RECOMMENTED BROKER REFFREL LINK
⤵️one.exnesstrack.net/a/uvd1etcgg1
PARTNER CODE⤵️
uvd1etcgg1
Disclaimer
The information and publications are not meant to be, and do not constitute, financial, investment, trading, or other types of advice or recommendations supplied or endorsed by TradingView. Read more in the Terms of Use.