📰 Impact of news:
1. PCE and Consumer Index
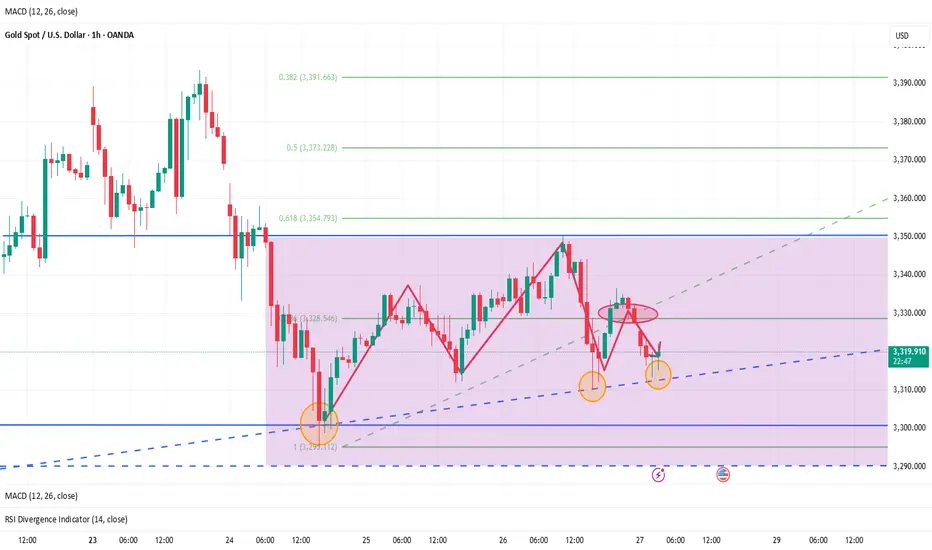
📈 Market analysis:
Judging from the 4H chart, the Bollinger Bands are closing and the MACD is showing a trend of forming a death cross, indicating that the short-selling momentum is still relatively strong in the short term. However, as the overall upward structure has not been destroyed, there is still a possibility of a rebound and repair in the future. During the day, we need to pay special attention to the support strength of the MA5 and MA10 moving averages. It is recommended to adopt the idea of shorting at high levels and going long at low levels. The key support below is the 3305-3295 area, and the upper resistance is the 3340-3350 range. However, judging from the chart, in the short term, there may be a rebound near 3313. At present, it has indeed rebounded to around 3319 as expected. If it falls weakly to this week's low of 3295, you can buy if it does not break. On the whole, if it rebounds to 3335-3345, you can consider shorting, and if the support below 3305-3295 is not broken, go long. Today is Friday, and as it is near the end of the month, market liquidity is strong. Please be cautious in your operations today and be sure to set stop losses strictly.
🏅 Trading strategies:
SELL 3335-3345-3350
TP 3320-3315-3300
BUY 3305-3295
TP 3310-3320-3330
If you agree with this view, or have a better idea, please leave a message in the comment area. I look forward to hearing different voices.
1. PCE and Consumer Index
📈 Market analysis:
Judging from the 4H chart, the Bollinger Bands are closing and the MACD is showing a trend of forming a death cross, indicating that the short-selling momentum is still relatively strong in the short term. However, as the overall upward structure has not been destroyed, there is still a possibility of a rebound and repair in the future. During the day, we need to pay special attention to the support strength of the MA5 and MA10 moving averages. It is recommended to adopt the idea of shorting at high levels and going long at low levels. The key support below is the 3305-3295 area, and the upper resistance is the 3340-3350 range. However, judging from the chart, in the short term, there may be a rebound near 3313. At present, it has indeed rebounded to around 3319 as expected. If it falls weakly to this week's low of 3295, you can buy if it does not break. On the whole, if it rebounds to 3335-3345, you can consider shorting, and if the support below 3305-3295 is not broken, go long. Today is Friday, and as it is near the end of the month, market liquidity is strong. Please be cautious in your operations today and be sure to set stop losses strictly.
🏅 Trading strategies:
SELL 3335-3345-3350
TP 3320-3315-3300
BUY 3305-3295
TP 3310-3320-3330
If you agree with this view, or have a better idea, please leave a message in the comment area. I look forward to hearing different voices.
Trade active
Gold rebounded as expected and then fell again. It has reached the 3295 line of support. I have already executed long orders according to the trading strategy.Related publications
Disclaimer
The information and publications are not meant to be, and do not constitute, financial, investment, trading, or other types of advice or recommendations supplied or endorsed by TradingView. Read more in the Terms of Use.
Related publications
Disclaimer
The information and publications are not meant to be, and do not constitute, financial, investment, trading, or other types of advice or recommendations supplied or endorsed by TradingView. Read more in the Terms of Use.