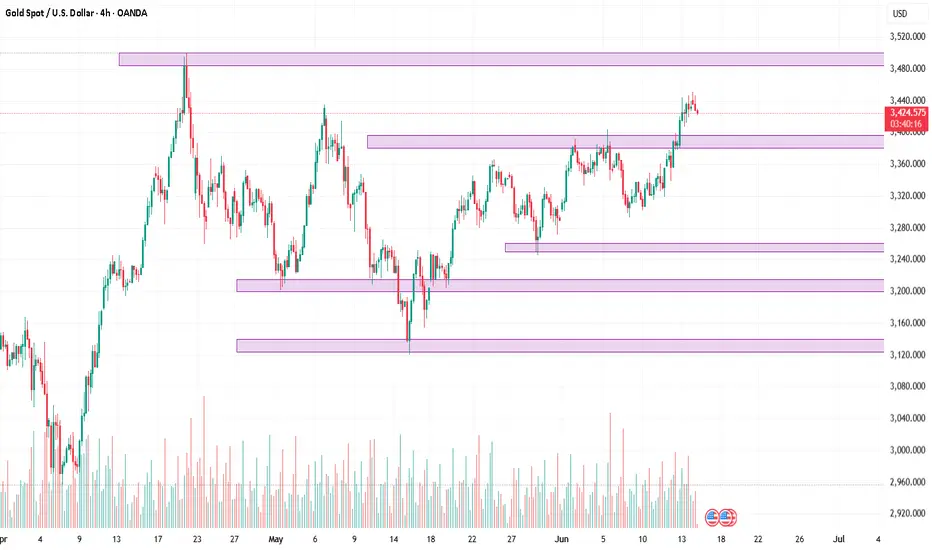
4H Chart: Market Structure & Bias
Gold’s 4-hour chart shows a bullish structure: price has been making higher highs and higher lows (a valid Break of Structure/BOS)
No bearish Change of Character (CHoCH) signal is present to suggest a reversal, so the overall bias remains bullish. In other words, the trend is intact and buyers still dominate. Key moving averages (not shown) also slope upward, reinforcing a “buy the dip” bias. We note that price recently stalled near 3427–3435, forming a small consolidation. This clustered area around the recent high acts as a near-term supply (resistance) zone (a possible order block where big players sold).
On the downside, prior support is visible around 3380–3400, where buyers stepped in on earlier pullbacks. In summary, the 4H bias is bullish, with dips into demand areas likely to attract buying interest.
Support/Demand Zones: At ~3380–3400 there is significant buying interest (a demand zone), as well as a minor support band around 3330–3350. These areas coincide with key Fibonacci retracements (around 50–62% of the last rally), making them high-probability bounce zones.
Resistance/Supply Zones: On the upside, the 3420–3435 range is resistance (recent swing high and a bearish order-block area).
Farther above, 3470–3485 is a major resistance cluster (around prior highs and a 61.8% extension), where supply may re-emerge.
Key Zones (4H Chart)
Buy Zone 1 (Demand): 3380–3400. This zone acted as support on prior pullbacks and aligns with ~50%–62% Fibonacci retracement levels. It represents a demand area (many buy orders), so bounces are likely here.
Buy Zone 2 (Support): 3330–3350. A deeper support area where buyers piled in previously. It coincides with the 61.8% Fib retrace of the last leg, making it a strong multi-purpose support/demand zone.
Sell Zone 1 (Supply): 3420–3435. This marks the recent 4H swing high and a potential bearish order block.
It has already capped rallies, so price may stall or reverse here on a retest.
Sell Zone 2 (Resistance): 3470–3485. A higher cluster of resistance (major psychological level and Fib extension) where selling could appear if gold extends its rally. This is a logical profit-taking area.
Each of these zones is a range (not just a line) to allow for some trade flexibility. We watch for price action (like pin bars or breakouts) within these ranges to signal entries.
1H Chart: Trade Setups
Buy at 3385–3395 (Long).
Entry Zone: 3385–3395 (just above the lower demand zone).
Stop-Loss: ~10 USD below the zone (around 3375).
Take-Profit: 3420 (minor resistance) and 3460 (next supply cluster).
Reason: This zone combines the 4H demand area and ~50% Fib support.
We expect bulls to defend this zone.
Trigger: Wait for a bullish reversal candle on 1H (e.g. a strong bullish pin bar or engulfing candle with a long lower wick). Such a candle (long-tail wick) at support indicates a liquidity grab by buyers. Alternatively, a clear 1H BOS above the last minor swing high would confirm strength and serve as a breakout entry.
Buy on 3425–3430 breakout (Long).
Entry Zone: Break above 3425–3430 (just above the recent 4H high).
Stop-Loss: ~10 USD below entry (around 3415).
Take-Profit: 3480–3490 (next resistance zone).
Reason: A push through the 3420–3435 supply zone would show buyers overcoming sellers. This would keep the uptrend running. The breakout opens room toward the 3470–3485 resistance area.
Trigger: Enter on a 1H bullish breakout/close above 3430 (a new higher high) – i.e. a bullish BOS confirming continued uptrend. Optionally look for a pullback to 3425 as a retest entry if the breakout is swift.
Buy at 3330–3340 (Long).
Entry Zone: 3330–3340 (deeper support zone on 4H).
Stop-Loss: ~10 USD below the zone (around 3320).
Take-Profit: 3380 (first target), then 3420.
Reason: This is a strong support/demand area (4H 61.8% Fib support). A drop here would be a deeper pullback – a higher-risk entry with a bigger reward if buyers step in.
Trigger: Look for a clear bullish reversal on 1H (e.g. hammer/engulfing candle) or a shift in structure (price fails to make a new low and instead forms a higher low). A bullish candlestick in this zone implies demand is defending it.
Each setup is aligned with the 4H bullish bias (we’re looking for long opportunities at support zones or breakouts). The ~$10 stops are set just beyond the defined entry zone, giving each trade a favorable risk/reward.
Takeaway: Gold’s 4-hour trend is up. We favor buying near the identified demand/support zones (or on a confirmed breakout above recent highs) and targeting the next resistance levels. Use tight stops (~$10 beyond each zone) and aim for 2:1+ reward on these high-probability setups.
Trade with the trend and respect the key zones above.
Note
Contact me to Join our group for free gold trading ideas on daily basisWatsapp Contact +971559939571
Disclaimer
The information and publications are not meant to be, and do not constitute, financial, investment, trading, or other types of advice or recommendations supplied or endorsed by TradingView. Read more in the Terms of Use.
Disclaimer
The information and publications are not meant to be, and do not constitute, financial, investment, trading, or other types of advice or recommendations supplied or endorsed by TradingView. Read more in the Terms of Use.