Gold Technical Outlook & Macro Setup
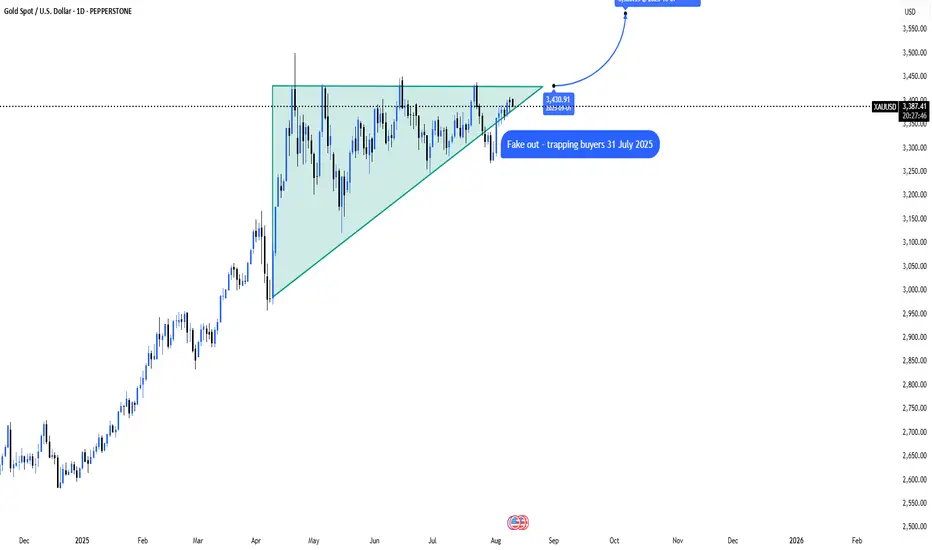
Gold appears to be forming a bullish flag pattern on the daily chart, following a brief dip in late July that didn’t gain traction. If prices can hold above the $3,406–$3,412 range, the trend remains upward. A daily close above this level, followed by a break of the early August high near $3,418, could trigger a move toward the June highs in the $3,448–$3,458 zone, and potentially up to the psychological level of $3,500.
This $3,500 target aligns with a classic flag breakout projection—adding the height of the flagpole (around $130) to the breakout base near $3,400. Supporting this view, COMEX gold futures hit an intraday record of ~$3,534 on August 8, showing the upside potential even as spot prices consolidate just below the June 13 peak of ~$3,448.
Key Macro Catalysts This Week
Several economic events this week could influence gold’s direction:
Bullish Scenario: A daily close above $3,406–$3,412, followed by a break of $3,418, opens the door to $3,448 and potentially $3,500. Expect resistance near $3,500.
Bearish Scenario: A close below ~$3,395–$3,384 suggests the flag pattern is still developing, and gold may remain range-bound until macro data provides a clearer direction.
Bottom Line: The technical setup supports a bullish breakout toward $3,500. This week’s economic data will likely determine whether that move materialises.
Gold appears to be forming a bullish flag pattern on the daily chart, following a brief dip in late July that didn’t gain traction. If prices can hold above the $3,406–$3,412 range, the trend remains upward. A daily close above this level, followed by a break of the early August high near $3,418, could trigger a move toward the June highs in the $3,448–$3,458 zone, and potentially up to the psychological level of $3,500.
This $3,500 target aligns with a classic flag breakout projection—adding the height of the flagpole (around $130) to the breakout base near $3,400. Supporting this view, COMEX gold futures hit an intraday record of ~$3,534 on August 8, showing the upside potential even as spot prices consolidate just below the June 13 peak of ~$3,448.
Key Macro Catalysts This Week
Several economic events this week could influence gold’s direction:
- Reserve Bank of Australia (RBA) Rate Decision – Tuesday, August 12 at 2:30 pm AEST (4:30 pm NZT). A dovish outcome could weaken the USD slightly, which tends to support gold.
- U.S. CPI (July) – Tuesday, August 12 at 8:30 am ET (Wednesday, August 13 at 12:30 am NZT). This is the main event for market volatility, especially for the dollar and real yields.
- UK GDP (June) – Thursday, August 14 at 6:00 pm NZT.
- China’s July Economic Data – Industrial production and retail sales expected between Thursday and Friday (August 14–15). These could affect global risk sentiment and the dollar.
- U.S. PPI (July) – Friday, August 15 at 8:30 am ET (Saturday, August 16 at 12:30 am NZT), rounding out the inflation picture.
- Trading Levels to Watch
Bullish Scenario: A daily close above $3,406–$3,412, followed by a break of $3,418, opens the door to $3,448 and potentially $3,500. Expect resistance near $3,500.
Bearish Scenario: A close below ~$3,395–$3,384 suggests the flag pattern is still developing, and gold may remain range-bound until macro data provides a clearer direction.
Bottom Line: The technical setup supports a bullish breakout toward $3,500. This week’s economic data will likely determine whether that move materialises.
Disclaimer
The information and publications are not meant to be, and do not constitute, financial, investment, trading, or other types of advice or recommendations supplied or endorsed by TradingView. Read more in the Terms of Use.
Disclaimer
The information and publications are not meant to be, and do not constitute, financial, investment, trading, or other types of advice or recommendations supplied or endorsed by TradingView. Read more in the Terms of Use.