1. Technical Overview – Gold  XAUUSD on 1H Timeframe
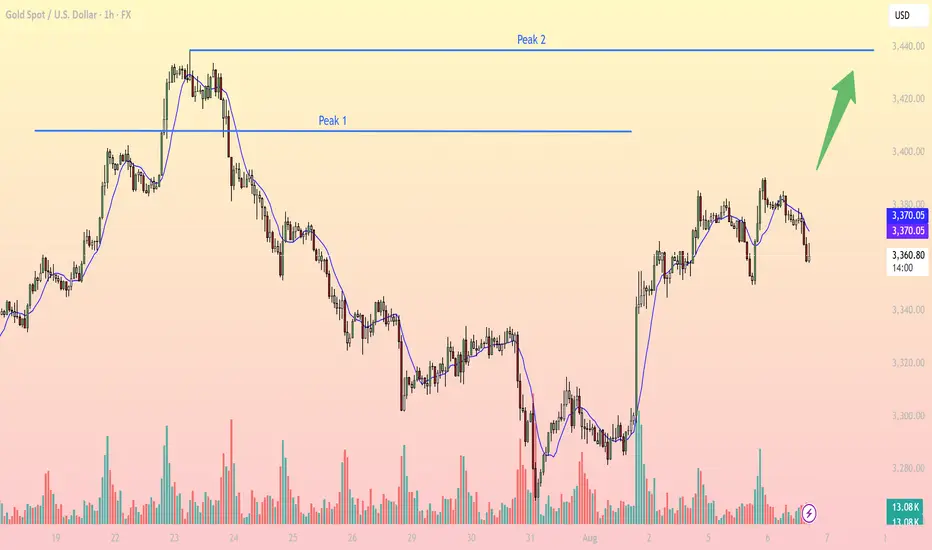
At the time of writing, gold is trading around 3,361 USD, continuing to range just below the key resistance zones after a short-term bullish recovery. Price structure is forming a potential higher low, but a clear breakout above resistance is still pending for trend confirmation.

2. Key Levels to Watch
Support 1: 3,335 – 3,340 - Near EMA10 + previous demand zone, potential bounce area
Resistance 1 (Peak 1): 3,375 – 3,380 - Previous local top, acted as rejection zone recently
Resistance 2 (Peak 2): 3,435 – 3,440 - Major breakout target from previous double top pattern
3. Indicators Analysis
EMA10 (blue line): Currently serving as dynamic intraday resistance. Price is oscillating around it, showing consolidation.
Volume Profile: Rising on bullish candles – indicates accumulation pressure, though not yet confirmed by breakout.
RSI (not shown): Likely hovering near 50 – neutral bias, awaiting directional trigger.
4. Price Behavior and Structure
Market has recovered from end-of-July selloff, creating a local bottom near 3,280.
Forming a potential cup-and-handle pattern targeting break of 3,375, with bullish continuation targeting 3,440.
Sideways movement on lower volume suggests accumulation phase before breakout.
5. Trading Strategy Suggestion (Intraday)
- Bullish Scenario:
Entry: Buy on confirmed breakout above 3,375 (Peak 1) with strong candle + volume.
SL: Below 3,360.
TP1: 3,400
TP2: 3,440 (Peak 2 – measured move from breakout)
- Reversal Scenario:
Sell on rejection from 3,375 if price forms double top or bearish engulfing candle.
SL: Above 3,380.
TP1: 3,345
TP2: 3,330
- Neutral Bias:
Wait for price to retest EMA10 and demand zone near 3,340 before entering long, especially if RSI and volume show divergence.
6. Final Notes
Price action is coiling below major resistance, hinting at a potential explosive move. Patience and level-based execution are key today. Scalpers can utilize 15m confirmation inside key zones for tighter entries.
At the time of writing, gold is trading around 3,361 USD, continuing to range just below the key resistance zones after a short-term bullish recovery. Price structure is forming a potential higher low, but a clear breakout above resistance is still pending for trend confirmation.
2. Key Levels to Watch
Support 1: 3,335 – 3,340 - Near EMA10 + previous demand zone, potential bounce area
Resistance 1 (Peak 1): 3,375 – 3,380 - Previous local top, acted as rejection zone recently
Resistance 2 (Peak 2): 3,435 – 3,440 - Major breakout target from previous double top pattern
3. Indicators Analysis
EMA10 (blue line): Currently serving as dynamic intraday resistance. Price is oscillating around it, showing consolidation.
Volume Profile: Rising on bullish candles – indicates accumulation pressure, though not yet confirmed by breakout.
RSI (not shown): Likely hovering near 50 – neutral bias, awaiting directional trigger.
4. Price Behavior and Structure
Market has recovered from end-of-July selloff, creating a local bottom near 3,280.
Forming a potential cup-and-handle pattern targeting break of 3,375, with bullish continuation targeting 3,440.
Sideways movement on lower volume suggests accumulation phase before breakout.
5. Trading Strategy Suggestion (Intraday)
- Bullish Scenario:
Entry: Buy on confirmed breakout above 3,375 (Peak 1) with strong candle + volume.
SL: Below 3,360.
TP1: 3,400
TP2: 3,440 (Peak 2 – measured move from breakout)
- Reversal Scenario:
Sell on rejection from 3,375 if price forms double top or bearish engulfing candle.
SL: Above 3,380.
TP1: 3,345
TP2: 3,330
- Neutral Bias:
Wait for price to retest EMA10 and demand zone near 3,340 before entering long, especially if RSI and volume show divergence.
6. Final Notes
Price action is coiling below major resistance, hinting at a potential explosive move. Patience and level-based execution are key today. Scalpers can utilize 15m confirmation inside key zones for tighter entries.
🪙 JOIN OUR FREE TELEGRAM GROUP 🪙
t.me/dnaprofits
Join the community group to get support and share knowledge!
️🥇 Exchange and learn market knowledge
️🥇 Support free trading signals
t.me/dnaprofits
Join the community group to get support and share knowledge!
️🥇 Exchange and learn market knowledge
️🥇 Support free trading signals
Related publications
Disclaimer
The information and publications are not meant to be, and do not constitute, financial, investment, trading, or other types of advice or recommendations supplied or endorsed by TradingView. Read more in the Terms of Use.