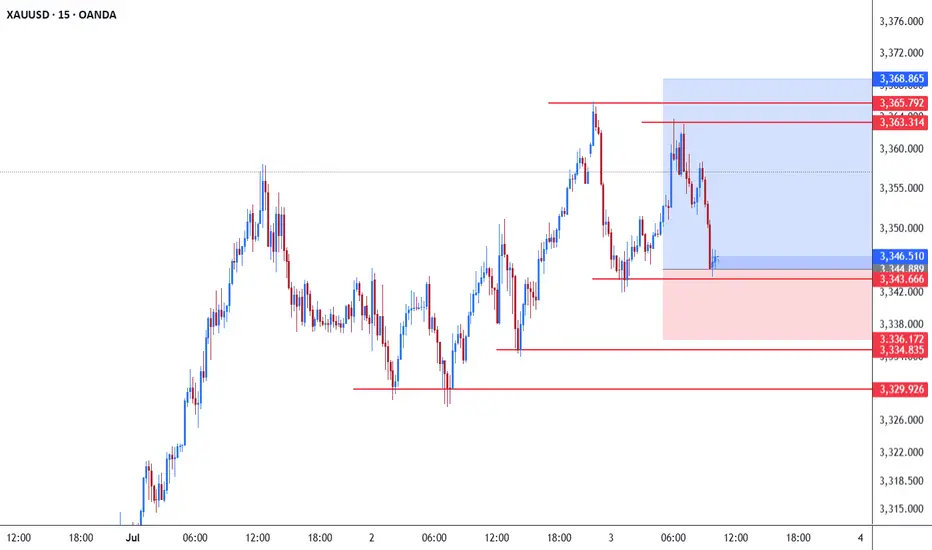
The chart of gold (XAU/USD) on the 15-minute timeframe shows that the price is moving within a corrective range after a strong bullish wave during which gold reached levels above $3,368 per ounce. Following a rejection from the resistance area near 3,365–3,368, the price began a downward correction and is currently stabilizing around the support zone at 3,344–3,343.
The price is now testing a key support area. If it holds above this zone, we may see a rebound toward the 3,363 and 3,365 resistance levels. A breakout above 3,368 could restore bullish momentum and open the way for new highs.
However, if the current support at 3,343 breaks, the bearish scenario would be favored, with potential targets at the next support levels around 3,336 and 3,329.
Likely Scenario: As long as gold holds above 3,343, the bullish bias remains valid. We will monitor price action at this area to confirm a possible rebound.
Key Levels to Watch:
Support: 3,343 – 3,336 – 3,329
Resistance: 3,363 – 3,365 – 3,368
This is a short-term analysis and depends on the price reaction at the current support zone.
Disclaimer
The information and publications are not meant to be, and do not constitute, financial, investment, trading, or other types of advice or recommendations supplied or endorsed by TradingView. Read more in the Terms of Use.
Disclaimer
The information and publications are not meant to be, and do not constitute, financial, investment, trading, or other types of advice or recommendations supplied or endorsed by TradingView. Read more in the Terms of Use.