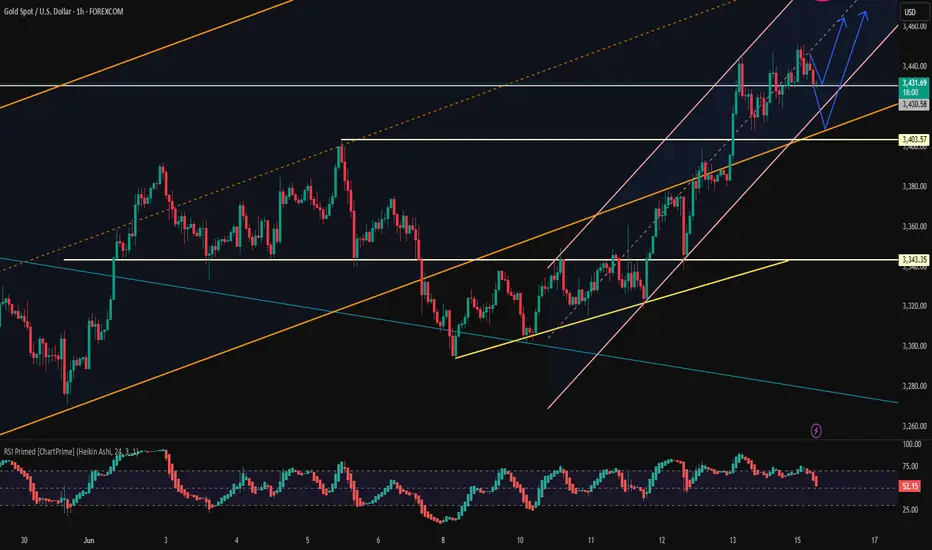
Last Friday, driven by the risk aversion sentiment in the Middle East, gold surged to 3445 in the Asian session and then fell under pressure. It stabilized and fluctuated at 3408 in the European session, and continued to fluctuate after probing 3346 for the second time in the US session. On Monday morning, it opened high and touched 3352 (upper track of the daily channel) and then came under pressure, but it was still mainly low-long under the support of risk aversion sentiment, and we need to be vigilant about the risk of event evolution.
Technical analysis
The weekly MACD high-level golden cross is shrinking, and the dynamic indicator STO is overbought, indicating that the shock is strong.
Key position: pressure: 3470 (parabolic turning point), 3500 (previous high). Support: 3365-3352 (weekly MA5/MA10 and naked K support).
The daily MACD golden cross is large, STO is overbought, and it is strong in the short term.
Key position: pressure: 3403-3398 (previous high conversion position). Support: 3387 (MA5), 3365 (MA10).
4-hour MACD high-level shrinking, STO adhesion, high-level oscillation.
Key position: Support: 3418-19, 3408 (short-term bullish defense line), followed by 3393-3378-3360. Moving average support: 3437 (MA5), 3423 (MA10).
Hourly MACD dead cross shrinking, STO downward, oscillation consolidation. Key support: 3331-3324 (middle track and MA30 overlap).
Trading strategy: Risk aversion is the main focus, but be wary of technical callbacks.
Short order opportunity
3446-48 light position short, stop loss 3453, target 3436-30-25.
3465-70 area short, stop loss 3475, target 3455-3440-3430.
Long order opportunity
3422-24 long, stop loss 3414, target 3432-45-52-65.
3394-96 long (stable), stop loss 3385, target to be determined (hold if it breaks through 3400).
Key observation points
Break above 3470: or test the 3500 mark.
Break below 3360: beware of a deep correction to the 3324-30 area.
Note: If the situation in the Middle East eases, long positions need to be adjusted in time; if it deteriorates suddenly, follow up with safe-haven buying.
Trade active
Gold's trend today showed a high and then a fall. The Asian session continued to pull back from the early high of 3452 to the European session low of 3409 and then turned into a narrow consolidation. The current price faces a short-term resistance of 3420. After breaking through, it will test the 3428-3430 range. If it stands firm, the hourly chart will return to the upward channel, and the US session is expected to hit 3452 or even higher. The key support below is at 3409 (the lower track of the 4-hour channel). If it loses 3400, it will turn short in the short term.
Overall, the gold price stabilized and rebounded near the support level, and the upward trend has not changed. It is recommended to maintain a low-long strategy as the main strategy in terms of operation.
Trade closed: target reached
Gold broke down in large volume during the US trading session. Although it rebounded to above 3400, the overall structure has been destroyed and entered the top long-short pattern stage. The key adjustment area is 3403-3413. The current 5-minute level is still in a downward trend, and the upper 3410 constitutes short-term suppression.
Before the price fails to effectively break through 3413 (the upper edge of the adjustment zone), it is no longer suitable for medium- and long-term long positions. In the short term, you can rely on the suppression of 3410-3413 to look for opportunities to short at highs at the 5-15 minute level, looking down at 3400-3395. If it breaks through 3413 strongly and stands firm, you need to wait and see whether it will return to the long structure.
The current trend is biased towards short-term shorts, and you need to pay attention to the breakthrough direction of the adjustment range to confirm the subsequent trend.
Free Signals:t.me/+CXftl_-QHEo2Yzc0
Disclaimer
The information and publications are not meant to be, and do not constitute, financial, investment, trading, or other types of advice or recommendations supplied or endorsed by TradingView. Read more in the Terms of Use.
Free Signals:t.me/+CXftl_-QHEo2Yzc0
Disclaimer
The information and publications are not meant to be, and do not constitute, financial, investment, trading, or other types of advice or recommendations supplied or endorsed by TradingView. Read more in the Terms of Use.