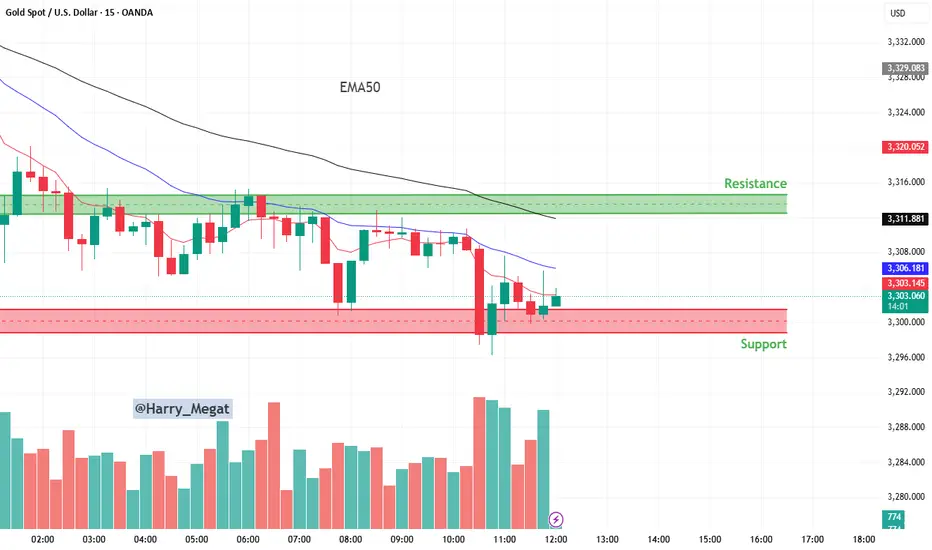
15-minute candlestick chart for Gold Spot (XAU/USD)
📉 **1. Trend Overview:**
* The overall direction is **bearish (downtrend)** — this is confirmed by:
* **Price below the 50 EMA** (black line)
* **Lower highs and lower lows**
* Continuous rejection from resistance
---
### 🟩 **2. Resistance Zone (\~3,312 to 3,320):**
* This is the area where price has **previously failed to break above** multiple times.
* Sellers dominate this level — price tends to drop when approaching here.
* A **bullish breakout above 3,320** may signal trend reversal.
---
### 🟥 **3. Support Zone (\~3,296 to 3,303):**
* This area has seen **strong buying** (look at the lower wicks and reversal candles).
* Price has bounced multiple times from this zone — it's acting as a **floor**.
* If price breaks **below this support**, further downside is likely.
---
### 📊 **4. Indicators:**
* **EMA 50 (black line)**: Shows the medium-term trend — it's sloping down, confirming bearish bias.
* **Shorter EMAs (red and blue)** are also above price, indicating pressure from sellers.
---
### 💡 **5. Price Action & Volume Insight:**
* A recent **rejection wick** at support suggests buyers are still active here.
* However, volume is increasing during the latest drop — **bearish momentum** is building.
* Watch how price behaves around 3,302–3,303 — consolidation here could lead to a breakout or breakdown soon.
---
### 🧠 **Trade Setups:**
#### **A. Bearish Scenario (Breakdown Trade):**
* 🔻 *Sell below 3,296 (support break)*
* 🎯 Target: 3,288 or lower
* 🛑 Stop Loss: Above 3,304
#### **B. Bullish Scenario (Bounce Trade):**
* 🔼 *Buy near 3,296–3,303 (support bounce)*
* 🎯 Target: 3,312–3,320 (resistance)
* 🛑 Stop Loss: Below 3,295
---
### ✅ **Summary:**
* Market is **bearish**, but currently **testing strong support**.
* Watch closely for a breakout below support or a pullback to resistance.
* Best strategy: **Sell the breakdown or sell the pullback to resistance.**
https://tradingview.sweetlogin.com/x/ql1u1hwp/
Trade active
✅ Update: Bullish Scenario B Played OutGold price reached $3,326, confirming the support bounce trade worked successfully.
🔼 Recap of Scenario B:
✅ Buy Entry: 3,296–3,303 ✅
🎯 Target Hit: 3,312–3,320 ➡️ Exceeded to 3,326
🛑 Stop Loss: Not triggered
📈 Outcome:
Plan worked perfectly — price respected support and broke resistance.
Bullish momentum may continue toward the next zone near $3,330–3,350, if volume and sentiment remain strong.
Trade closed: target reached
trade closedDisclaimer
The information and publications are not meant to be, and do not constitute, financial, investment, trading, or other types of advice or recommendations supplied or endorsed by TradingView. Read more in the Terms of Use.
Disclaimer
The information and publications are not meant to be, and do not constitute, financial, investment, trading, or other types of advice or recommendations supplied or endorsed by TradingView. Read more in the Terms of Use.