Throughout May, the news backdrop, including international trade tariffs and geopolitical turmoil, led to a technical peak of around $3,430 and a low near $3,130 in gold. As of now, the price per ounce is stable at around $3,300, roughly the same level as at the beginning of the month.
This shows that supply and demand forces are basically balanced, and prices are maintained between these two extremes. Gold technicals further confirm this and highlight the importance of the $3,300 level.
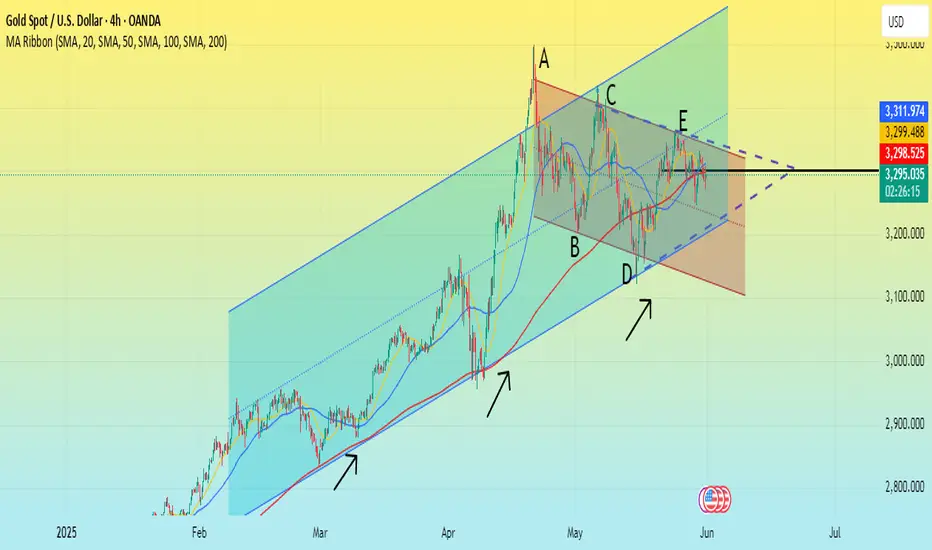
Bearish perspective: The A→B→C→D→E sequence forms a peak high and a cycle low, which is a clear downtrend signal. The trajectory is marked in red, and the upper line constitutes resistance.
Bullish perspective: Since the beginning of 2025, the price of gold has been in an upward trend, represented by the blue channel, and its lower boundary constitutes key support (marked with arrows).
It is worth noting that these support and resistance lines are converging, forming a narrowing triangle. This shows that supply and demand are balancing and the market has reached a consensus around the $3,300 level, which is exactly the central axis of the triangle.
Based on this, we can reasonably assume that the technical side of gold in June may continue to fluctuate within this triangle unless a special event occurs that causes a significant break in the current balance.
This shows that supply and demand forces are basically balanced, and prices are maintained between these two extremes. Gold technicals further confirm this and highlight the importance of the $3,300 level.
Bearish perspective: The A→B→C→D→E sequence forms a peak high and a cycle low, which is a clear downtrend signal. The trajectory is marked in red, and the upper line constitutes resistance.
Bullish perspective: Since the beginning of 2025, the price of gold has been in an upward trend, represented by the blue channel, and its lower boundary constitutes key support (marked with arrows).
It is worth noting that these support and resistance lines are converging, forming a narrowing triangle. This shows that supply and demand are balancing and the market has reached a consensus around the $3,300 level, which is exactly the central axis of the triangle.
Based on this, we can reasonably assume that the technical side of gold in June may continue to fluctuate within this triangle unless a special event occurs that causes a significant break in the current balance.
Disclaimer
The information and publications are not meant to be, and do not constitute, financial, investment, trading, or other types of advice or recommendations supplied or endorsed by TradingView. Read more in the Terms of Use.
Disclaimer
The information and publications are not meant to be, and do not constitute, financial, investment, trading, or other types of advice or recommendations supplied or endorsed by TradingView. Read more in the Terms of Use.