Looking at this XAU/USD weekly chart, here’s the detailed analysis:
---
1. Market Structure
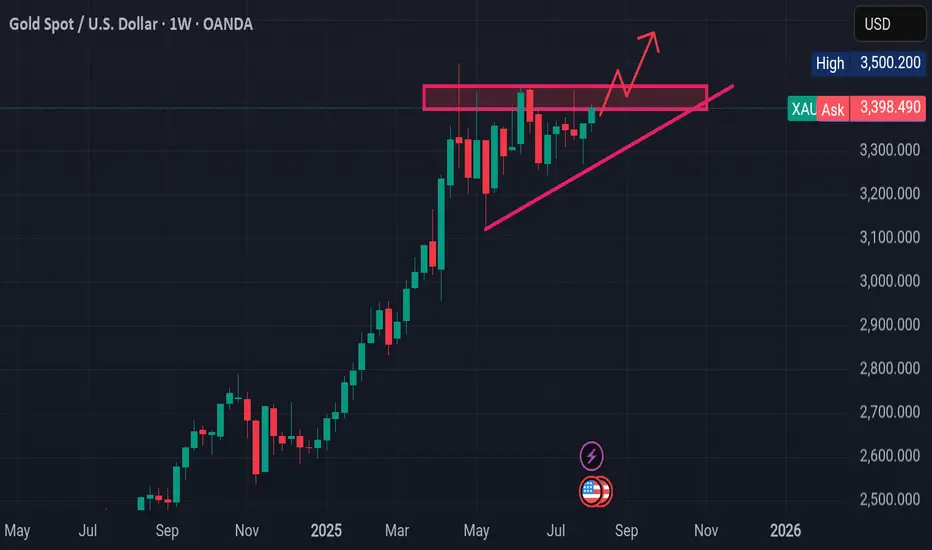
Pattern: The market is forming an ascending triangle — higher lows on the trendline and a relatively flat resistance zone around $3,390 – $3,420.
Trend: The broader structure is bullish; price has been in a strong uptrend since late 2024 with healthy pullbacks.
---
2. Key Levels
Resistance zone: $3,390 – $3,420 (multiple rejections here).
Trendline support: Rising support currently near $3,300 and climbing each week.
Breakout target: If price closes above $3,420, the measured move from the triangle suggests a potential rally toward $3,500 – $3,550.
Breakdown risk: A weekly close below $3,300 trendline could signal a deeper pullback toward $3,200.
---
3. Price Action Signals
Bullish bias if: Price breaks and closes above the horizontal resistance with strong volume.
Bearish risk if: Price fails to break resistance and closes below trendline — could indicate trend exhaustion.
---
4. Context With COT Report
If the latest COT report shows increasing non-commercial (speculator) net longs and falling shorts, this supports the bullish breakout case.
If non-commercial longs are declining or shorts increasing, it suggests that this resistance may hold, possibly leading to a pullback.
---
5. Summary
Primary bias: Bullish continuation toward $3,500+ if resistance breaks.
Alternative bias: Pullback to $3,200 if trendline fails.
Watch the next 1–2 weekly candles for a decisive move — this is a classic pressure build-up before a breakout.
---
1. Market Structure
Pattern: The market is forming an ascending triangle — higher lows on the trendline and a relatively flat resistance zone around $3,390 – $3,420.
Trend: The broader structure is bullish; price has been in a strong uptrend since late 2024 with healthy pullbacks.
---
2. Key Levels
Resistance zone: $3,390 – $3,420 (multiple rejections here).
Trendline support: Rising support currently near $3,300 and climbing each week.
Breakout target: If price closes above $3,420, the measured move from the triangle suggests a potential rally toward $3,500 – $3,550.
Breakdown risk: A weekly close below $3,300 trendline could signal a deeper pullback toward $3,200.
---
3. Price Action Signals
Bullish bias if: Price breaks and closes above the horizontal resistance with strong volume.
Bearish risk if: Price fails to break resistance and closes below trendline — could indicate trend exhaustion.
---
4. Context With COT Report
If the latest COT report shows increasing non-commercial (speculator) net longs and falling shorts, this supports the bullish breakout case.
If non-commercial longs are declining or shorts increasing, it suggests that this resistance may hold, possibly leading to a pullback.
---
5. Summary
Primary bias: Bullish continuation toward $3,500+ if resistance breaks.
Alternative bias: Pullback to $3,200 if trendline fails.
Watch the next 1–2 weekly candles for a decisive move — this is a classic pressure build-up before a breakout.
Disclaimer
The information and publications are not meant to be, and do not constitute, financial, investment, trading, or other types of advice or recommendations supplied or endorsed by TradingView. Read more in the Terms of Use.
Disclaimer
The information and publications are not meant to be, and do not constitute, financial, investment, trading, or other types of advice or recommendations supplied or endorsed by TradingView. Read more in the Terms of Use.