1. Visible Pattern
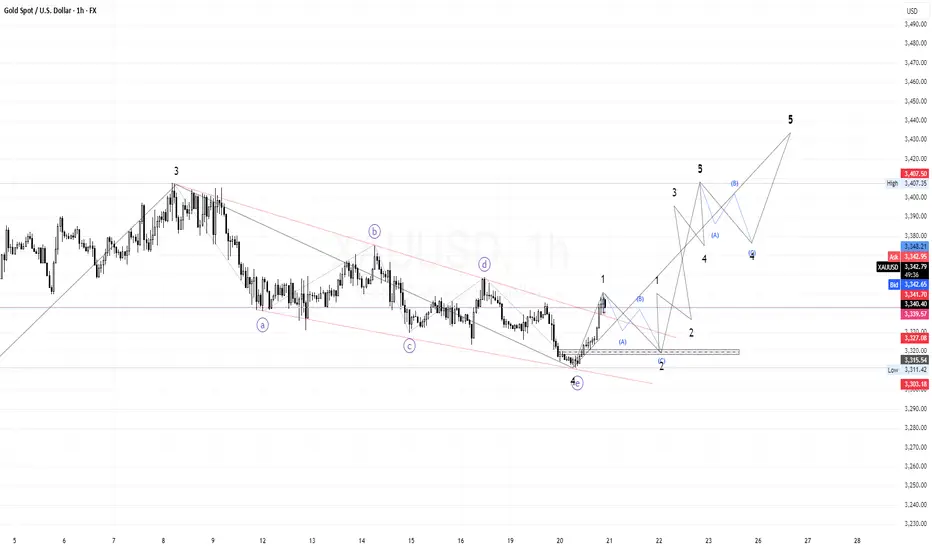
The chart shows a completed complex corrective pattern (ABCDE) inside a descending channel.
After the E wave finished, price started moving up, forming an initial impulse (wave 1).
Currently, the market is projected to build a 5-wave impulsive structure (Elliott Impulse):
Wave 1 is completed.
Wave 2 (pullback/retrace) is in progress.
Next target is a strong Wave 3, followed by Wave 4 correction, then Wave 5 final impulse up.
2. Key Levels
Key support (wave 2 area): around 3327 – 3315
(must hold for the bullish scenario to remain valid).
Nearby resistances:
3340 → minor resistance.
3380 → target for wave 3 start.
3407 → previous high & strong bullish confirmation.
Wave 5 target: could reach 3430 – 3450 if the full impulse develops.
3. Scenarios
📌 Bullish (main scenario)
As long as price holds above 3315, strong potential to continue upward.
After wave 2 completes, wave 3 is usually extended and aggressive → best buy opportunities after retrace ends.
📌 Bearish (alternative / invalidation)
If price breaks below 3315 – 3303 (previous low), the bullish impulsive scenario becomes invalid → price could continue deeper down.
4. Strategy
Buy the dip around support zone (3327 – 3315).
Short-term targets: 3380 – 3407.
Mid-term target (wave 5): 3430 – 3450.
Stop loss: below 3303.
👉 Conclusion: XAUUSD has just completed wave 1 and is now heading into wave 2 (pullback). As long as support holds, the bullish scenario towards wave 3–5 remains valid with targets at 3380–3450.
Disclaimer
The information and publications are not meant to be, and do not constitute, financial, investment, trading, or other types of advice or recommendations supplied or endorsed by TradingView. Read more in the Terms of Use.
Disclaimer
The information and publications are not meant to be, and do not constitute, financial, investment, trading, or other types of advice or recommendations supplied or endorsed by TradingView. Read more in the Terms of Use.