Hey Traders,
Following up on the general weakness we discussed in Gold, here's a closer look at a specific trade setup that's unfolding right now. This is a textbook example of a high-probability short setup according to Volume Spread Analysis (VSA).
Let's break down the story the volume is telling us.
1. The Breakdown: Sellers Show Their Hand
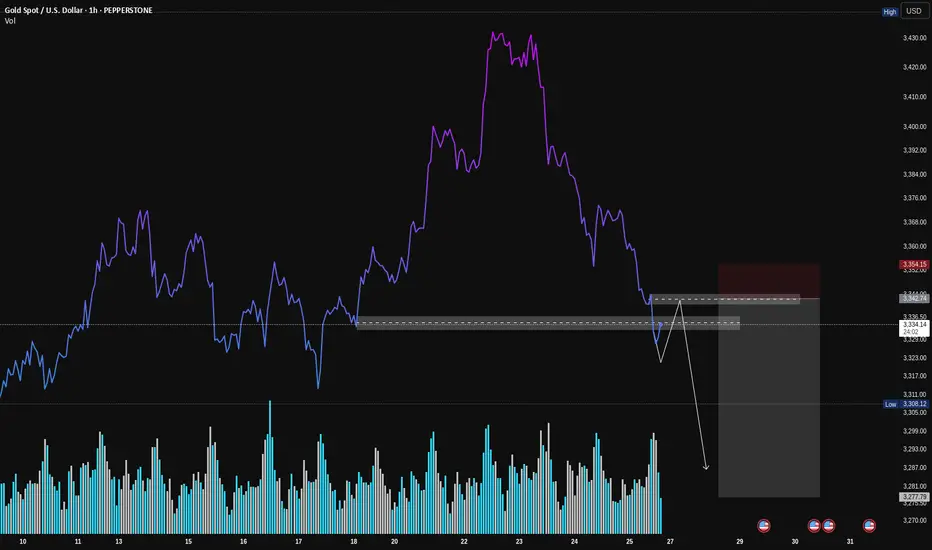
First, look at how the price broke down hard through that support level (the grey box). Notice the volume on that sharp drop? It was high. This is our clue that sellers are strong and in control. They had enough power to smash right through a level that was previously holding the price up.
2. The Retest: Buyers Don't Show Up
Now, the price is creeping back up to that same exact level. But here's the most important clue: look at the volume on this rally. It's much lower than the volume on the breakdown.
This is what VSA calls a "No Demand" rally. It’s like the market is trying to push a car uphill without any gas. It tells us that strong buyers (the "smart money") have no interest in buying at these prices.
3. The Setup: Selling into Weakness
This combination creates a classic short setup:
How to Potentially Trade It
The grey box represents a high-probability entry zone. To time an entry, you could watch for a clear rejection signal right inside this zone. For example:
A "rejection candle" (like a pin bar) that pushes into the zone but gets slammed back down.
An up-bar with a tiny body and very low volume, showing buyers are completely exhausted.
Seeing one of these signs would be the final confirmation that sellers are about to take back control.
Conclusion:
This is a powerful setup because all the pieces line up: the background is weak, sellers have shown their strength, and buyers are now showing no interest at a key resistance level.
Disclaimer:
Following up on the general weakness we discussed in Gold, here's a closer look at a specific trade setup that's unfolding right now. This is a textbook example of a high-probability short setup according to Volume Spread Analysis (VSA).
Let's break down the story the volume is telling us.
1. The Breakdown: Sellers Show Their Hand
First, look at how the price broke down hard through that support level (the grey box). Notice the volume on that sharp drop? It was high. This is our clue that sellers are strong and in control. They had enough power to smash right through a level that was previously holding the price up.
2. The Retest: Buyers Don't Show Up
Now, the price is creeping back up to that same exact level. But here's the most important clue: look at the volume on this rally. It's much lower than the volume on the breakdown.
This is what VSA calls a "No Demand" rally. It’s like the market is trying to push a car uphill without any gas. It tells us that strong buyers (the "smart money") have no interest in buying at these prices.
3. The Setup: Selling into Weakness
This combination creates a classic short setup:
- Logic: We are looking to sell at a level where old support has flipped into new resistance.
- Confirmation: The low volume on the retest confirms the rally is weak and likely to fail.
How to Potentially Trade It
The grey box represents a high-probability entry zone. To time an entry, you could watch for a clear rejection signal right inside this zone. For example:
A "rejection candle" (like a pin bar) that pushes into the zone but gets slammed back down.
An up-bar with a tiny body and very low volume, showing buyers are completely exhausted.
Seeing one of these signs would be the final confirmation that sellers are about to take back control.
Conclusion:
This is a powerful setup because all the pieces line up: the background is weak, sellers have shown their strength, and buyers are now showing no interest at a key resistance level.
Disclaimer:
This is my personal analysis using VSA and is for educational purposes only. It is not financial advice. Always do your own research and manage your risk. Good luck, traders!
Trade active
Trade Update: +410 Pips and Counting!Our setup has played out perfectly, rewarding us with +410 pips so far—a clean 1:3.6 Risk/Reward ratio.
The position is now risk-free, with the stop loss moved to our entry. I'm holding for the final target at 3285, aiming for a total gain of +570 pips (1:5 RR).
Trade closed manually
Final Update on the Short TradeExcellent work closing the trade and locking in those profits! The VSA signs of weakness we saw at the top played out perfectly, leading to that significant drop. A well-executed trade from start to finish.
Current Thoughts: Has the Tide Turned?
Looking at the new 15-minute chart, my perspective has shifted from bearish to cautiously bullish. The story in the volume suggests the downtrend has been halted, and a potential reversal is building.
Here’s the VSA breakdown:
The Selling Climax: See that massive volume spike at the low on July 28th? That wasn't just panic selling. That was likely a Selling Climax, where heavy supply was absorbed by strong buyers ("smart money") stepping in to stop the fall.
The Successful Test: This is the most important clue. After the climax, the price came back down to test the low, but this time on very low volume. This is a classic Sign of Strength, indicating that the aggressive selling pressure is exhausted.
Accumulation is Underway: The current price action, grinding slowly higher and forming higher lows (along your trendline), looks like a textbook accumulation phase. Buyers appear to be quietly building positions in this range.
My current outlook:
The path of least resistance now appears to be shifting to the upside. The immediate hurdle is the resistance zone around $3,324 - $3,330.
A decisive break and hold above this level, especially on increasing volume, would confirm the accumulation and could signal the start of the next leg up.
Disclaimer
The information and publications are not meant to be, and do not constitute, financial, investment, trading, or other types of advice or recommendations supplied or endorsed by TradingView. Read more in the Terms of Use.
Disclaimer
The information and publications are not meant to be, and do not constitute, financial, investment, trading, or other types of advice or recommendations supplied or endorsed by TradingView. Read more in the Terms of Use.