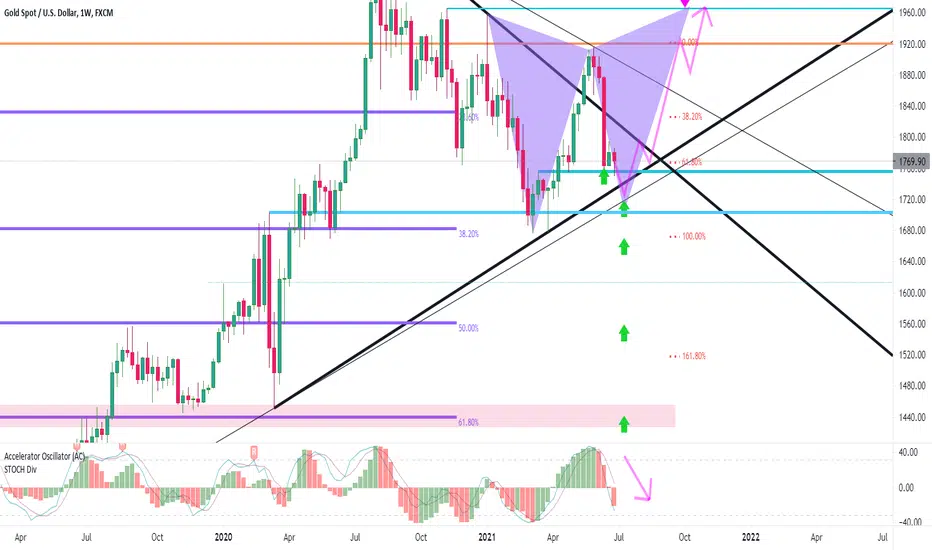
as i predict Dollar index by daily chart pinbar go up =gold must go down
for next 3 month ,after speak big traders in banks,funds , we predict butterfly pattern comming for next 60 day
save in mind,draw on your chart =
green arrow ,important ,powerfull limit order place with sl=10$ trailstop(breakeven)=10$ (after 6$-10$ ,move SL to open price,then give time go more)
in green arrow we will buy and hold for new high (min 1920)
tradingview.com/chart/jtsoM2GC/
note=like 1740 buy in gold, EURUSD have same buylimit signal too ,check my last eurusd analyse
Disclaimer
The information and publications are not meant to be, and do not constitute, financial, investment, trading, or other types of advice or recommendations supplied or endorsed by TradingView. Read more in the Terms of Use.
Disclaimer
The information and publications are not meant to be, and do not constitute, financial, investment, trading, or other types of advice or recommendations supplied or endorsed by TradingView. Read more in the Terms of Use.