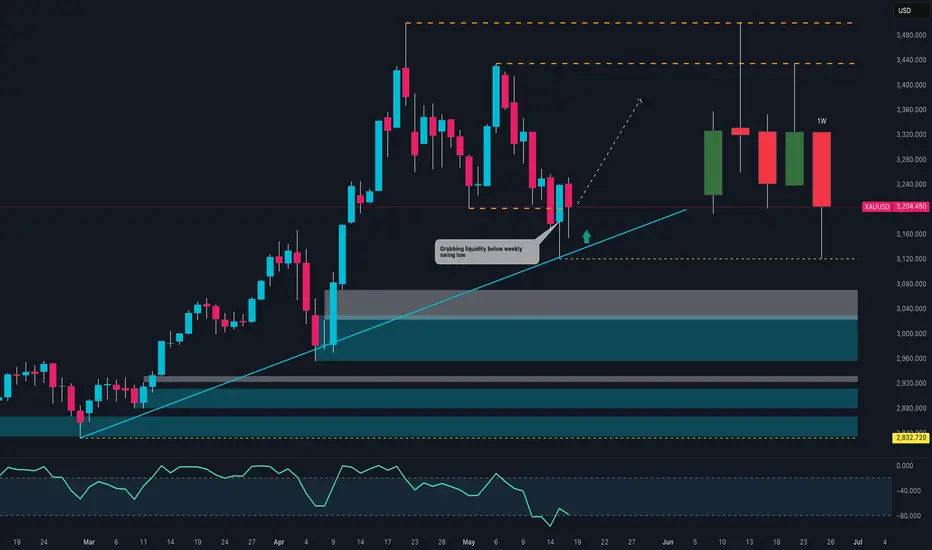
Gold reacted sharply at a major structural level last week, sweeping liquidity below the previous weekly swing low. That move was immediately followed by a strong bullish rejection candle with a deep lower wick — signaling aggressive buyer absorption.
The price also respected a long-term ascending trendline, which has acted as dynamic support since early March. Two demand zones are clearly identified on the chart (based on HTF imbalances and previous accumulation ranges), and price tapped the upper zone near 3,160 before bouncing.
The bullish structure remains intact unless price closes below 3,080 on the weekly. Until then, the trendline and recent liquidity grab favor further upside continuation.
📉 COT Data Insight
Gold Non-Commercials:
Net long remains strong (238k long vs 76k short)
New long contracts: +746 | Shorts: +2,034
However, a large drop in spread positions (-12,424) signals a tactical unwind in hedge fund exposure
USD Index (DXY) Non-Commercials:
Net long positions down significantly (-5,712)
Softening dollar bias adds tailwind for gold in the short term
🧠 COT Takeaway
Speculative interest continues to favor Gold, while USD positioning weakens — supporting the idea of a technical bounce and potential bullish continuation.
🧮 Retail Sentiment (Contrarian View)
Retail traders are currently 54% short on XAU/USD — classic contrarian signal suggesting the path of least resistance remains to the upside.
📆 Seasonal Outlook (May Performance)
Historically, May tends to be a neutral-to-weak month for gold based on 10- to 15-year data.
However, in the last 2 years, May has delivered clear bullish seasonality, which reinforces the case for upward momentum after pullbacks.
✅ Summary
🔸 Directional Bias: Moderately Bullish
🔸 Invalid if: Weekly close < 3,080
🎯 First Target: 3,280 – 3,320
🎯 Extended Target: 3,440 resistance zone
📌 Final Thoughts
The technical reaction from demand, supportive COT structure, soft USD positioning, and contrarian sentiment all point toward potential continuation higher.
As long as Gold holds above the 3,080 zone, the bulls remain in control.
📈 Nicola | EdgeTradingJourney
Documenting my path to $1M in prop capital through real trading, discipline, and analysis.
Documenting my path to $1M in prop capital through real trading, discipline, and analysis.
Disclaimer
The information and publications are not meant to be, and do not constitute, financial, investment, trading, or other types of advice or recommendations supplied or endorsed by TradingView. Read more in the Terms of Use.