I. Analysis of core contradictions
Focus of long and short game:
Short advantage: geopolitical risk premium fades + hawkish stance of the Federal Reserve
Multiple support: technical oversold (daily RSI 28) + physical buying intervention
Key turning point: Whether 3340 breaks through or not determines the short-term direction
Institutional capital trends:
COMEX large sell orders pile up above 3350 (about 150 million US dollars)
Shanghai gold premium maintains 9-10 US dollars (Asian buying support)
II. Technical essentials analysis
Key chart signals:
4-hour chart: The descending channel is complete (upper rail 3342, lower rail 3288)
1-hour chart: Potential double bottom formed (neckline 3332, volume cooperation)
Daily chart: 5/10-day moving average dead cross angle expands (3326 vs 3349)
Key resistance and support levels:
Resistance level: 3335 (Asian session high) → 3342 (trend line) → 3352 (breakthrough level)
Support level: 3315 (intraday low) → 3295 (weekly low) → 3280 (200-day moving average)
III. Practical trading strategy
Main strategy: trend following trading
Entry trigger: 3342-3345 test short selling (4-hour trend line suppression)
Stop loss setting: 3353 (breakthrough previous high + spread buffer)
Target: 3310 → 3295 → 3280
Auxiliary Support strategy: defensive long position
Trigger condition: bullish engulfing + volume expansion below 3300
Stop loss setting: 3285 (0.5% below the previous low)
Target position: 3320-3330
IV. Risk control matrix
Breakthrough scenario response:
Break above 3352: stop loss short immediately, reverse light position to try long (target 3375)
Break below 3285: chase short position not more than 1% (target 3265)
Operational iron rule:
Strictly follow the 1:2 risk-return ratio
Single loss ≤ 0.5% of account net value
Clear 80% of position before the US market closes
Trade active
Summary of the latest trend analysis and operation suggestions for gold:
Core viewpoint:
Short-term bottoming signs appear: After gold fluctuated in the 3310-3340 range, the daily line closed positive and the lows gradually rose, indicating that the bulls began to counterattack and may bottom out and rebound in the short term.
Key support and resistance:
Support level: 3325-3315 (strong support 3295, breaking through will destroy the rebound structure).
Resistance level: 3340 (see 3357-3367 after breaking through).
Operation strategy: mainly long on pullbacks, and short shorts can be supplemented by rebounds when encountering resistance.
Detailed analysis:
Influence of news:
Positive factors: weaker US dollar, falling US Treasury yields, and uncertainty in the geopolitical situation (there are still variables in the Iran-Israel ceasefire).
Negative risk: If US economic data (such as initial jobless claims, GDP, and durable goods orders) are stronger than expected, it may suppress gold prices.
Focus: US economic data released today (especially GDP final value and durable goods orders), if the data is weak, it will strengthen the safe-haven demand for gold.
Technical signals:
Daily level: After bottoming out, it closed positive, MACD has a potential bottom divergence, and if it stands firm at 3340, it may start a further rebound.
1-hour level: The low point (3312→3320) gradually rises, 3340 is the short-term long-short watershed, and it is expected to test above 3360 after breaking through.
Key points:
Bullish defense line: 3315-3320 area, if it holds, the rebound pattern will be maintained.
Short counterattack point: 3350-3355 (short short can be shorted when it is touched for the first time), after breaking through, it will step back to confirm and then chase more.
Operation suggestions:
Bullish strategy:
Radical: 3325-3320 light position long, stop loss below 3310, target 3340→3357.
Conservatives: Wait for a breakout of 3340 and then follow up with long orders near 3330, with a target of 3360.
Short strategy:
3350-3355 short under pressure (stop loss 3365), target 3325.
If the data is negative and the gold price falls below 3315, you can chase the short to 3300-3295.
Risk warning:
Data market volatility is amplified: US GDP and durable goods orders may cause violent fluctuations, and you need to be vigilant about rapid losses.
Geopolitical changes: If the conflict in the Middle East re-emerges, the safe-haven property of gold will dominate the market, and short orders need to be cautious.
Summary: Gold tends to fluctuate upward in the short term, but you need to be vigilant about the callback caused by negative data. Operate in the 3320-3360 range during the day, and follow the trend after breaking through.
Trade closed: target reached
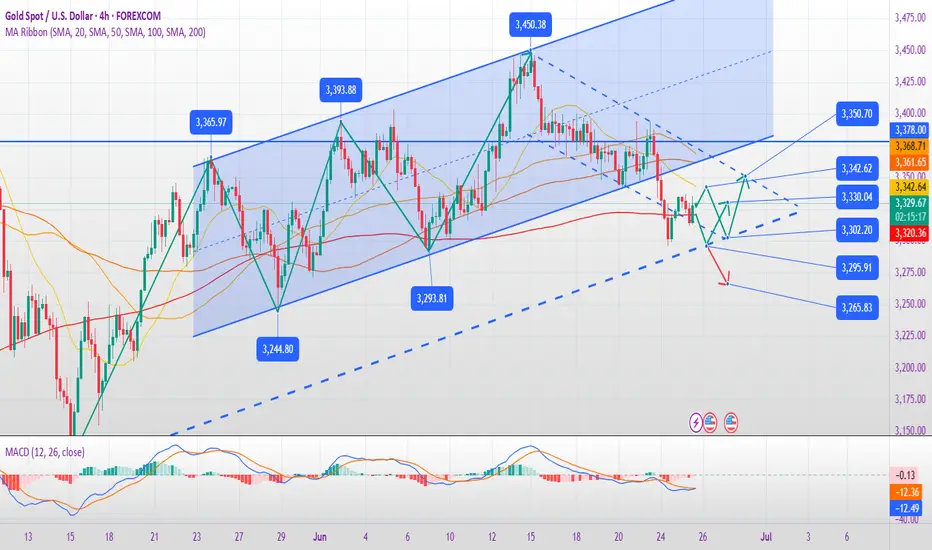
Analysis and strategy of the latest gold trend on June 27:
Core logic of the current market
Gold has recently shown the characteristics of oscillating bottoming out. The daily level forms a key support near 3295. If it holds this position, it may start a rebound; on the contrary, if it falls below, it may continue the downward trend. The focus of the short-term long and short competition is concentrated in the 3340-3355 area, and the breakthrough direction will determine the trend of the next stage.
Analysis of key technical signals
1. Daily level: bottoming out and rebounding, bulls are accumulating momentum
Form: The previous day bottomed out and closed positive, and the rebound continued yesterday, indicating that the 3295 support is effective and the short-term short momentum is weakened.
Key pressure: 3355 (Bollinger middle track), it is expected to test 3385 after breaking through.
Key support: 3295 (recent low), breaking below will open up downside space.
2. 4-hour level: Golden cross is bullish, but BOLL suppression has not been broken
The stochastic indicator (KD) is golden cross, short-term bullish, but the price is still subject to the pressure of 3345-3347 (BOLL middle track).
The MACD momentum column is shrinking, indicating that long and short positions are still competing, and it is necessary to observe whether it can stand above 3340.
3. 1-hour level: Moving average dead cross, short-term still has the risk of callback
The short-term moving average (5/10EMA) dead cross indicates that there is still selling pressure in the short term. If it cannot break through 3340, it may fall back to the support of 3312-3315.
Key watershed: 3340 (1-hour trend suppression), if it breaks through, the short-term will turn strong.
Today's operation strategy (key range trading)
1. Short order strategy (short under pressure near 3340)
Entry point: 3340-3345 (1-hour pressure + 4-hour BOLL middle track)
Stop loss: above 3355 (short order invalid if it breaks through)
Target: 3320-3315 (previous low support area)
Logic: Before effectively breaking through 3340, short-term high-short order can still bet on callback.
2. Long order strategy (stable long near 3315)
Entry point: 3312-3315 (yesterday's low support)
Stop loss: below 3307 (to prevent false break)
Target: 3330-3340 (reduce position in pressure area)
Logic: If the retracement does not break the support, you can bet on a rebound at a low price.
3. Breakout strategy (turn to long after stabilizing 3355)
Confirmation signal: 1-hour closing stabilizes at 3355
Target: 3385 (daily resistance)
Logic: The trend becomes stronger after the breakthrough, and you can follow the trend.
Key risk reminder
Dollar trend: If the US dollar rebounds sharply, it may suppress the rebound space of gold.
Market sentiment: Rising risk aversion (such as geopolitical conflicts) may promote gold breakthroughs.
Fed policy expectations: If the recent speeches of officials are hawkish, it may limit the rise of gold.
Summary: Sell high and buy low, wait for a breakthrough
Oscillating range: 3315-3340, you can sell high and buy low.
Breakthrough direction: If it stabilizes at 3355, it will be bullish to 3385; if it falls below 3295, the trend will turn bearish.
Trading discipline: Strictly stop loss and avoid carrying orders.
❤️Free gold trading signals:t.me/+OJSbWQ6F4KM2Mzk1
💥Gold trading analyst | Technology + logic dual drive
💯Intraday/band strategy analysis | Risk control first, win in stability
💥Gold trading analyst | Technology + logic dual drive
💯Intraday/band strategy analysis | Risk control first, win in stability
Related publications
Disclaimer
The information and publications are not meant to be, and do not constitute, financial, investment, trading, or other types of advice or recommendations supplied or endorsed by TradingView. Read more in the Terms of Use.