Price Trend:
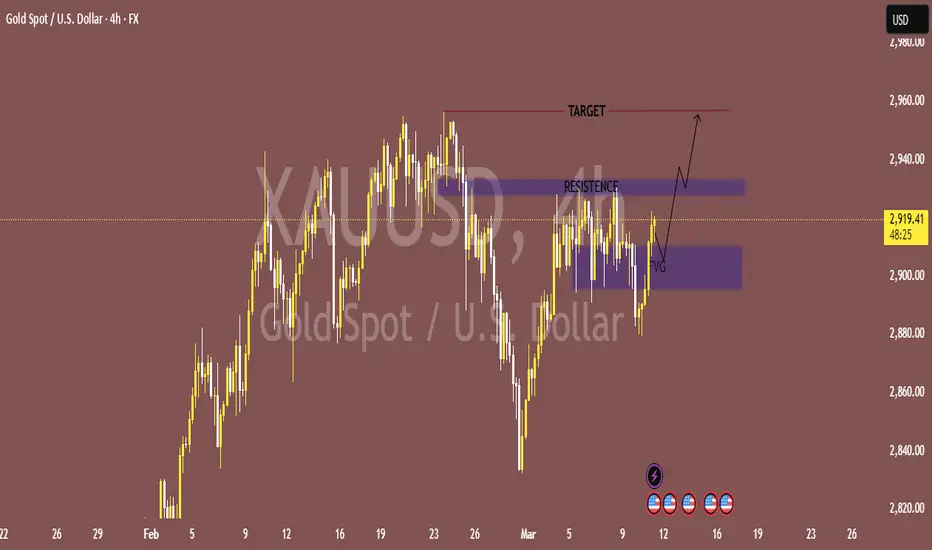
The chart shows a steady upward movement in the price of gold, starting from late February into March 2025. The price is currently around $2,917.25 and has reached near the resistance level marked on the chart.
Resistance Zone:
The resistance area, located between $2,911 and $2,920, seems to be a crucial level. Gold has faced difficulty breaking through this level multiple times, as seen in the sideways movement after hitting the resistance.
Target Level:
The target above this resistance zone is marked around $2,960, indicating the potential for further price appreciation if gold can break above the current resistance.
Price Action and Potential Breakout:
There's a potential for a breakout as the price appears to be forming a bullish structure near the resistance, indicating that if gold manages to break above this zone, it could continue its upward trajectory toward the target area.
Volume and Market Sentiment:
The volume indicators on the lower part of the chart are not heavily discussed here, but there might be a correlation with market strength. The chart suggests potential consolidation before a move upward if the resistance breaks.
Conclusion:
Gold is currently testing the resistance area, and if it successfully breaks through, it could aim for the target level around $2,960. Keep an eye on this price level as it could signal further bullish movement.
Trade active
Trade closed: target reached
join my tellegram channel
t.me/JaMesGoldFiGhteR786
join my refferal broker
one.exnesstrack.org/a/g565sj1uo7?source=app
t.me/JaMesGoldFiGhteR786
join my refferal broker
one.exnesstrack.org/a/g565sj1uo7?source=app
Disclaimer
The information and publications are not meant to be, and do not constitute, financial, investment, trading, or other types of advice or recommendations supplied or endorsed by TradingView. Read more in the Terms of Use.