🔥 GOLD (XAU/USD) Daily Analysis – July 27, 2025
By: Asad Yaseen | Timeframe: 1D
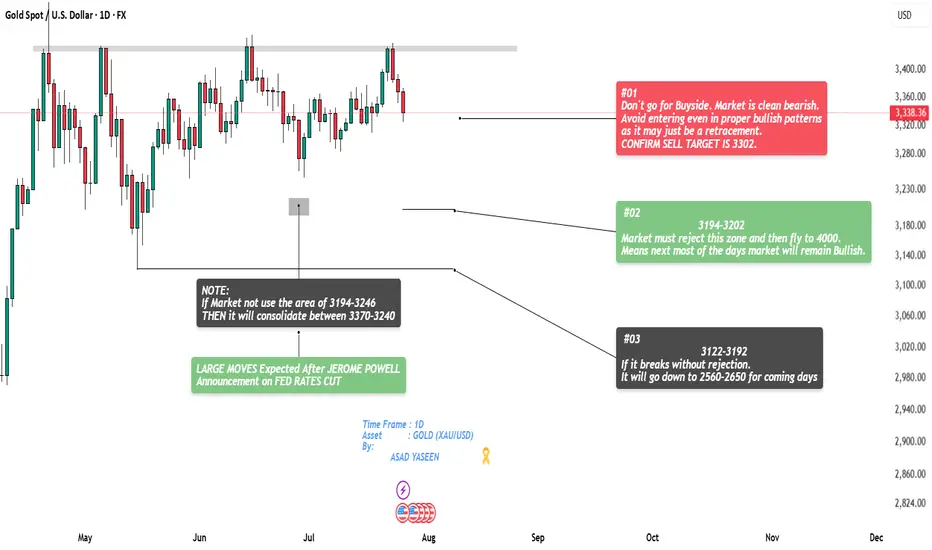
Gold is currently positioned at a crucial turning point, and price action over the next few days will determine the medium-term direction. Here's a breakdown of all possible scenarios based on key supply-demand zones and institutional behaviour:
🔴 Scenario #01 – Bearish Bias Active (Confirmed Setup)
📉 Market Structure: Bearish
The current trend is clearly bearish, with no strong signs of reversal. Even if bullish patterns appear, they are likely just short-term retracements.
confirmed short target is 3302.
going long unless deeper zones show clear rejection.
🟢 Scenario #02 – Possible Bullish Rejection Zone
📍 Key Zone: 3194 – 3202
If the market tests and rejects this demand zone, a strong upside move is expected. This could mark the start of a rally toward 4000+, indicating a shift in macro sentiment.
A bullish rejection here would favour trend reversal trades.
⚫ Scenario #03 – Bearish Expansion Below Demand
📍 Breakdown Zone: 3122 – 3192
If price breaks below this zone with no rejection, expect a deeper drop. Targets are set between 2650 – 2560 in the coming days. Setup for swing or position traders waiting for clean continuation signals.
⚠️ Neutral Consolidation Warning
If price does not engage the 3194–3246 zone, expect sideways movement between 3370 – 3240 with low momentum.
📰 Fundamental Catalyst to Watch:
Expect major volatility after Jerome Powell’s FED Rate Cut announcement.
This news event may trigger massive liquidity shifts and trend-defining moves.
💡 Reminder for Traders:
Trade with structure, not emotions. Watch how price reacts at key levels and align with macro bias.
No confirmation = no trade.
📈 If you find this analysis helpful, don’t forget to like & follow for more high-probability setups.
Drop your thoughts or questions below 👇
By: Asad Yaseen | Timeframe: 1D
Gold is currently positioned at a crucial turning point, and price action over the next few days will determine the medium-term direction. Here's a breakdown of all possible scenarios based on key supply-demand zones and institutional behaviour:
🔴 Scenario #01 – Bearish Bias Active (Confirmed Setup)
📉 Market Structure: Bearish
The current trend is clearly bearish, with no strong signs of reversal. Even if bullish patterns appear, they are likely just short-term retracements.
confirmed short target is 3302.
going long unless deeper zones show clear rejection.
🟢 Scenario #02 – Possible Bullish Rejection Zone
📍 Key Zone: 3194 – 3202
If the market tests and rejects this demand zone, a strong upside move is expected. This could mark the start of a rally toward 4000+, indicating a shift in macro sentiment.
A bullish rejection here would favour trend reversal trades.
⚫ Scenario #03 – Bearish Expansion Below Demand
📍 Breakdown Zone: 3122 – 3192
If price breaks below this zone with no rejection, expect a deeper drop. Targets are set between 2650 – 2560 in the coming days. Setup for swing or position traders waiting for clean continuation signals.
⚠️ Neutral Consolidation Warning
If price does not engage the 3194–3246 zone, expect sideways movement between 3370 – 3240 with low momentum.
📰 Fundamental Catalyst to Watch:
Expect major volatility after Jerome Powell’s FED Rate Cut announcement.
This news event may trigger massive liquidity shifts and trend-defining moves.
💡 Reminder for Traders:
Trade with structure, not emotions. Watch how price reacts at key levels and align with macro bias.
No confirmation = no trade.
📈 If you find this analysis helpful, don’t forget to like & follow for more high-probability setups.
Drop your thoughts or questions below 👇
Trade active
Note
✅ First Target Hit 3302Price respected the marked zone and reached TP1 🎯 as planned.
Structure and momentum aligned well 📊.
Now monitoring price behavior at this level
Will look for continuation setups toward TP2 or signs of reversal 🔄.
Good confirmation of bias and execution 🔥.
Note
AS Gold exact hit 3302 and reverse. Now This is Retracement So, wait for Bearish Pattern for more sell side between 3322-3328. Next Target will be 3275 But it depends on how market behave at retracement level so if Sell Side will be continue after retracement then safe target will be 3295(Identify Bullish Pattern IF NOT then keep your position OPEN till 3275)
Note
IF Market will not behave as I expect SO, don't consider this SETUP for take any Trade!Note
3322-3328 Area Use. Market Tap at 3330 So, Now wait for Bearish patternNote
SELL SIDE Entry Active!Note
Market Looks LIKE Bullish So I EXIT. Let's SEE !Note
Sad for My EXIT Decision😐Note
As Our 3302 Target were hit yesterday. After this market use that area as Support As I Mention in chart.Market Must Reject this Zone to FLY 4000. SAME AS IT IS DONE But because of FED RATES UNCHANGE So, Market grow gradually untill FED RATES not finallize because Fed will keep interest rates unchange this week, although at least two officials might disagree with that decision. So OverALL Bias is Bullish FOR NOW!
Note
Next Target is possible 3202-3211. Let's See how market behave. Don't go for BUY SIDE until we see rejection in 1D TF at mentioned area in Analysis.Note
AS current structure market is Bullish with proper trend SO, If both news positive then we can go for sell side for liquidity grab and hit the target of 3194-3202. Currently market consolidate at 3308-3314.According to me Sell side possibility is 78% . Let's See what happened next ...
Note
Friday Market will be Bearish ! I want rejection under 3122-3192 Please :D
Note
It's time to change the BIAS :DBY BY Sellers :)
Trade closed manually
Disclaimer
The information and publications are not meant to be, and do not constitute, financial, investment, trading, or other types of advice or recommendations supplied or endorsed by TradingView. Read more in the Terms of Use.
Disclaimer
The information and publications are not meant to be, and do not constitute, financial, investment, trading, or other types of advice or recommendations supplied or endorsed by TradingView. Read more in the Terms of Use.