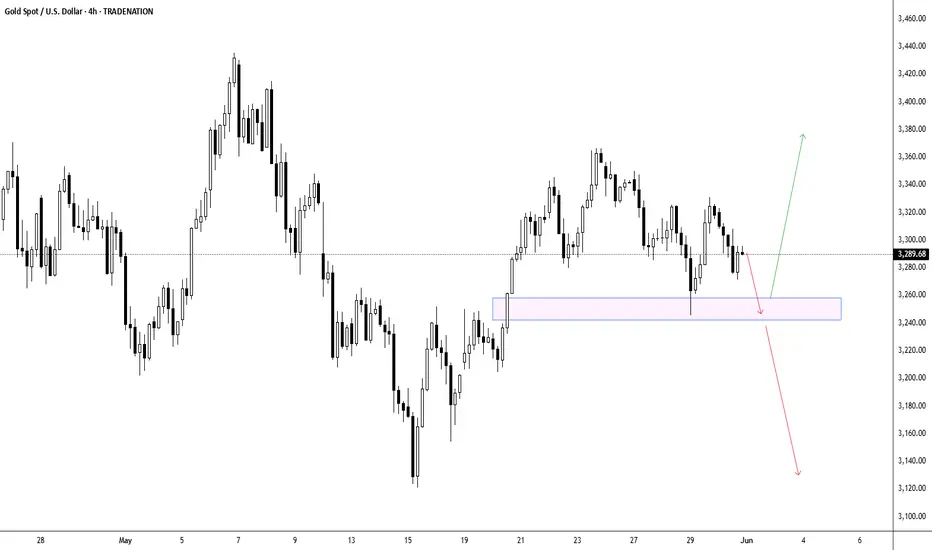
Looking at this gold spot chart, the precious metal appears to be consolidating within a defined range after experiencing significant volatility throughout May. The price is currently trading near the upper boundary of the marked support zone around $3,250-$3,260, following a recent pullback from higher levels. Given the technical setup and the proximity to this key support area, there's a strong probability that gold will retest this support zone in the coming sessions. This retest will be critical in determining the next directional move - if the support holds and buyers step in, we could see a bounce back toward the upside targeting previous resistance levels, potentially challenging the recent highs. However, if the support fails to hold under selling pressure, gold could continue its downward trajectory, opening the door for further declines toward lower support levels. The market's reaction at this support zone will likely dictate whether the current consolidation resolves bullishly or bearishly.
Disclosure: I am part of Trade Nation's Influencer program and receive a monthly fee for using their TradingView charts in my analysis.
Disclosure: I am part of Trade Nation's Influencer program and receive a monthly fee for using their TradingView charts in my analysis.
Disclaimer
The information and publications are not meant to be, and do not constitute, financial, investment, trading, or other types of advice or recommendations supplied or endorsed by TradingView. Read more in the Terms of Use.
Disclaimer
The information and publications are not meant to be, and do not constitute, financial, investment, trading, or other types of advice or recommendations supplied or endorsed by TradingView. Read more in the Terms of Use.